Properties
Properties
Every graphic object of PowerScene has properties. Property values can be read by using scripts.
The below features represent the property of text graphic objects.
Setting the PowerShape through PowerScene studio is editing the screen which displayed on the initial canvas. It is able to change the property of graphic objects dynamically, by using scripts.
The properties do not apply to all graphic objects, and the object is defined based on the property. Users can set graphic objects using the appropriate properties.
Properties
Object |
Function |
Property |
Example |
Common |
Visible / Invisible |
Visible |
obj = canvas.getObject(‘shape’) obj.setProperty(‘Visible’, 1) #Visible obj.setProperty(‘Visible’, 0) #Invisible |
Object Enabled / Disabled |
Enabled |
obj = canvas.getObject(‘shape’) obj.setProperty(‘Enabled’, 1) #Enabled obj.setProperty(‘Enabled’, 0) #Disabled |
|
Object width setting |
Width |
obj = canvas.getObject(‘shape’) obj.setProperty(‘Width’, 100.5) #Width setting |
|
Object height setting |
Height |
obj = canvas.getObject(‘shape’) obj.setProperty(‘Height', 100.5) #Height setting |
|
Line color setting |
PenColor |
obj = canvas.getObject(‘shape’) obj.setProperty(‘PenColor’, QColor(255,0,0,0)) #Color setting # Set the color using QColor. |
|
Line style setting |
PenStyle |
obj = canvas.getObject(‘shape’) obj.setProperty(‘PenStyle’, 1) #Style value #0: No pen, 1: Solid line ,2:Dash line, 3:Dot line, 4:Dash-Dot line, 5 Dash-Dot-Dot line |
|
Line width setting |
PenWidth |
obj = canvas.getObject(‘shape’) obj.setProperty(‘PenWidth’, 2.5) #Pen width setting |
|
Fill style setting |
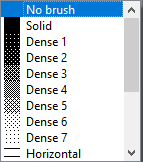
BrushStyle |
obj = canvas.getObject(‘shape’) obj.setProperty(‘BrushStyle, 1) #Style value #0: No fill, 1: Solid, 2:Dense1, 3:Dense2, 4:Dense3 ··· # Refer to the order of properties in the property window.
|
|
Fill color setting |
BrushColor |
obj = canvas.getObject(‘shape’) obj.setProperty(‘BrushColor’, QColor(255,0,0,0)) #Fill setting # Set the color using QColor. |
|
Gradation color setting |
GradationColor |
obj = canvas.getObject(‘shape’) obj.setProperty(‘GradationColor’, QColor(255,0,0,0)) #Gradation color setting # Set the color using QColor. |
|
Face text setting |
FaceText |
obj = canvas.getObject(‘shape’) obj.setProperty(‘FaceText’, ‘Execute’) # Face text setting |
|
Face text alignment |
FontAlign |
obj = canvas.getObject(‘shape’) obj.setProperty(‘FontAlign’, 1) # Left alignment #Alignment value 1: Left , 2:Right , 84:Center |
|
Text color setting |
FontColor |
obj = canvas.getObject(‘shape’) obj.setProperty(‘FontColor’, QColor(255,0,0,0)) # Font color setting # Set the color using QColor. |
|
Text size setting |
FontSize |
obj = canvas.getObject(‘shape’) obj.setProperty(‘FontSize’, 10.5) #Font size setting |
|
Text font setting |
FontFamily |
obj = canvas.getObject(‘shape’) obj.setProperty(‘FontFamily’, ’Godic’) #Change the font to Godic. |
|
Bold setting |
Bold |
obj = canvas.getObject(‘shape’) obj.setProperty(‘Bold’, 1) # Set bold obj.setProperty(‘Bold’, 0) # Release bold |
|
Italic setting |
Italic |
obj = canvas.getObject(‘shape’) obj.setProperty(‘Italic’, 1) # Set italic obj.setProperty(‘Italic’, 0) # Release italic |
|
Underline setting |
Underline |
obj = canvas.getObject(‘shape’) obj.setProperty(‘Underline’, 1) # Set underline obj.setProperty(‘Underline’, 0) # Release underline |
|
Images
|
Import images |
PixmapPath |
obj = canvas.getObject(‘shape’) obj.setProperty(‘PixmapPath’, ‘D:/photo.png’) # Import images |
SVG Images
|
Import SVG images |
svgPath |
obj = canvas.getObject(‘shape’) obj.setProperty(‘svgPath’, ‘D:/photo.svg') # Import SVG images |
Circle Bar
|
Minimum setting |
Min |
obj = canvas.getObject(‘shape’) obj.setProperty(‘Min’, 0) |
Maximum setting |
Max |
obj = canvas.getObject(‘shape’) obj.setProperty(‘Max’, 100) |
|
Value setting |
Value |
obj = canvas.getObject(‘shape’) obj.setProperty(‘Value’, 50) |
|
Start angle setting |
StartAngle |
obj = canvas.getObject(‘shape’) obj.setProperty(‘StartAngle’, 90) |
|
End angle setting |
EndAngle |
obj = canvas.getObject(‘shape’) obj.setProperty(‘EndAngle’, 180) |
|
Font color setting |
FontColor |
obj = canvas.getObject(‘shape’) obj.setProperty(‘FontColor’, QColor(255,0,0,0)) #Font color setting # Set the color using QColor. |
|
Data color setting |
Data Color |
obj = canvas.getObject(‘shape’) obj.setProperty(‘Data Color’, QColor(255,0,0,0)) # Data color setting # Set the color using QColor. |
|
Data Background color setting |
Background Data Color |
obj = canvas.getObject(‘shape’) obj.setProperty(‘Background Data Color’, QColor(255,0,0,0)) # Data Background color setting # Set the color using QColor. |
|
Inner fill color setting |
Inner Fill Color |
obj = canvas.getObject(‘shape’) obj.setProperty(‘Inner Fill Color’, QColor(255,0,0,0)) # Inner fill color setting # Set the color using QColor. |
|
Decimal setting |
Decimals |
obj = canvas.getObject(‘shape’) obj.setProperty(‘Decimals’, 2) # Decimal setting |
|
Graphic Button
|
Flat shape setting |
Flat |
obj = canvas.getObject(‘shape’) obj.setProperty(‘Flat’, 1) # Set flat shape obj.setProperty(‘Flat’, 0) # Release flat shape |
Pie/Arc
|
Start angle setting |
startAngle |
obj = canvas.getObject(‘shape’) obj.setProperty(‘startAngle’, 90) |
Span angle setting |
spanAngle |
obj = canvas.getObject(‘shape’) obj.setProperty(‘spanAngle’, 290) |
|
Image Frames
|
Play images |
Play |
obj = canvas.getObject(‘shape’) obj.setProperty(‘Play’, 1) # Play images obj.setProperty(‘Play’, 0) # Stop playing images |
Image interval setting |
Interval |
obj = canvas.getObject(‘shape’) obj.setProperty(‘Interval’, 100) # Set interval as 100ms |
|
Current frame setting |
Frame |
obj = canvas.getObject(‘shape’) obj.setProperty(‘Frame’, 2) # Display the second image |
|
GIF Images
|
Import GIF images |
gifPath |
obj = canvas.getObject(‘shape’) obj.setProperty(‘gifPath’, ‘D:/photo.gif’) # Import GIF images |
Image play rate setting |
Speed |
obj = canvas.getObject(‘shape’) obj.setProperty(‘Speed’, 100) # Set interval as 100ms |
|
Play run / stop |
Run |
obj = canvas.getObject(‘shape’) obj.setProperty(‘Run’, 1) # Play images obj.setProperty(‘Run’, 0) # Stop playing images |
|
Gauge Bar
|
Minimum setting |
Min |
obj = canvas.getObject(‘shape’) obj.setProperty(‘Min’, 0) |
Maximum setting |
Max |
obj = canvas.getObject(‘shape’) obj.setProperty(‘Max’, 100) |
|
Value setting |
Value |
obj = canvas.getObject(‘shape’) obj.setProperty(‘Value’, 50) |
|
Start angle settng |
StartAngle |
obj = canvas.getObject(‘shape’) obj.setProperty(‘StartAngle’, 90) |
|
End angle setting |
EndAngle |
obj = canvas.getObject(‘shape’) obj.setProperty(‘EndAngle’, 180) |
|
Text color setting |
FontColor |
obj = canvas.getObject(‘shape’) obj.setProperty(‘FontColor’, QColor(255,0,0,0)) #Font color setting # Set the color using QColor |
|
Decimal setting |
Decimals |
obj = canvas.getObject(‘shape’) obj.setProperty(‘Decimals’, 2) # Decimal setting |
|
Neddle Gauge
|
Minimum setting |
Min |
obj = canvas.getObject(‘shape’) obj.setProperty(‘Min’, 0) |
Maximum setting |
Max |
obj = canvas.getObject(‘shape’) obj.setProperty(‘Max’, 100) |
|
Value setting |
Value |
obj = canvas.getObject(‘shape’) obj.setProperty(‘Value’, 50) |
|
Start angle setting |
StartAngle |
obj = canvas.getObject(‘shape’) obj.setProperty(‘StartAngle’, 90) |
|
End angle setting |
EndAngle |
obj = canvas.getObject(‘shape’) obj.setProperty(‘EndAngle’, 180) |
|
Slider/Bar
|
Minimum setting |
Min |
obj = canvas.getObject(‘shape’) obj.setProperty(‘Min’, 0) |
Maximum setting |
Max |
obj = canvas.getObject(‘shape’) obj.setProperty(‘Max’, 100) |
|
Value setting |
Value |
obj = canvas.getObject(‘shape’) obj.setProperty(‘Value’, 50) |
|
Line, Connertor, Curves
|
Arrowhead shape setting |
ArrowHead |
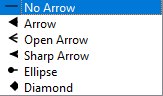
obj = canvas.getObject(‘shape’) obj.setProperty(‘ArrowHead’, 1) #Arrow setting 0: No arrow , 1:Arrow, 2:Open arrow, 3: Sharp arrow, 4:Oval arrow, 5: Diamond arrow
|
Arrowtail shape setting |
ArrowTail |
obj = canvas.getObject(‘shape’) obj.setProperty(‘ArrowTail’, 1) # Arrow setting 0: No arrow , 1:Arrow, 2:Open arrow, 3: Sharp arrow, 4:Oval arrow, 5: Diamond arrow
|
|
Image Button
|
Value setting |
Value |
obj = canvas.getObject(‘shape’) obj.setProperty(‘Value’, 50) |
Enabled / Disabled |
Enabled |
obj = canvas.getObject(‘shape’) obj.setProperty(‘Enabled’, 1) #Enabled obj.setProperty(‘Enabled’, 0) #Disabled |
|
Rounded Rectangular
|
Round X rate setting |
RoundX |
obj = canvas.getObject(‘shape’) obj.setProperty(‘RoundX’, 10) |
Round Y rate setting |
RoundY |
obj = canvas.getObject(‘shape’) obj.setProperty(‘RoundY’, 10) |
|
LED Numbers
|
LED color setting |
LED Color |
obj = canvas.getObject(‘shape’) obj.setProperty(‘LED Color’, QColor(255,0,0,0)) # LED color setting # Set the color using QColor. |
Background color setting |
Background Color |
obj = canvas.getObject(‘shape’) obj.setProperty(‘LED Color’, QColor(255,0,0,0)) # LED background color setting # Set the color using QColor. |
|
Digit count setting |
Digit Count |
obj = canvas.getObject(‘shape’) obj.setProperty(‘Digit Count’, 5) # Change to the five digit number. |
|
Value setting |
Value |
obj = canvas.getObject(‘shape’) obj.setProperty(‘Value’, 50) |
|
Video widget
|
Play camera |
Play |
obj = canvas.getObject(‘video’) obj.setProperty(‘Play’, 1) #Play camera |
Stop playing |
Stop |
obj = canvas.getObject(‘video’) obj.setProperty(‘Stop’, 1) #Stop playing |
|
Camera network address setting |
URL |
obj = canvas.getObject(‘video’) # Camera network address setting and playing obj.setProperty(‘URL’, 'http://222.222.1.119:81/videostream.cgi?user=admin&pwd=888888&resolution=640.mjpeg' ) |
|
Pie Chart
|
Chart ratio setting |
Value |
obj = canvas.getObject(‘Pie Chart’) obj.setProperty('0_Value', 60) # Item1 obj.setProperty('1_Value', 60) # Item2 obj.setProperty('2_Value', 60) # Item3 # Each item is drawn as the ratio of (each area/total area). |


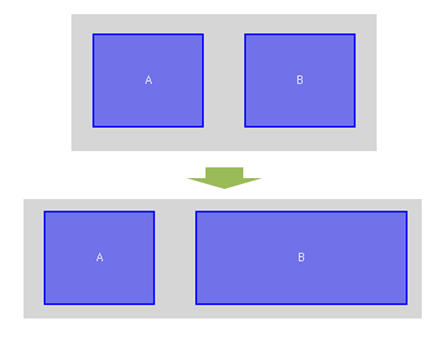
Width is a property about the X-axis size of graphic objects. ㆍ Obtain information about the X-axis size. |
※ Objects : Apply to all graphic objects. |
int setProperty( 'Width' , size:X-axis length ) |
Width is a property about the X-axis size of graphic objects. |
ㆍ Enter the X-axis size of graphic objects to size as Numeric. |
※ Objects : Apply to all graphic objects. |
Example)
RectangleA = canvas.getObject('Rectangle_A'); RectangleB = canvas.getObject('Rectangle_B'); BWidth = RectangleA.getProperty('Width'); << Enter Width of RectangleB to BWidth RectangleB.setProperty('Width', BWidth+100); << Save Width of RectangleB to BWidth+100
|
|
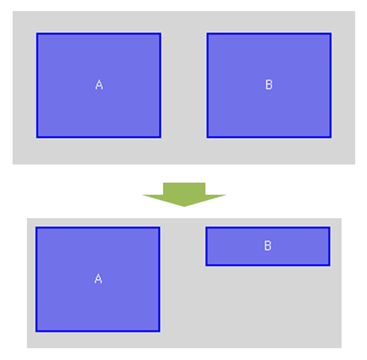
Height is a property about the Y-axis size of graphic objects. ㆍ Obtain information about the Y-axis size. |
※ Objects: Apply to all graphic objects. |
setProperty( 'Height', size:Y-axis size ) |
Height is a property about the Y-axis size of graphic objects. |
ㆍ Enter the Y-axis size to size as Numeric. |
※ Objects : Apply to all graphic objects. |
Example)
RectangleA = canvas.getObject('Rectangle_A'); RectangleB = canvas.getObject('Rectangle_B'); BHeight = RectangleA.getProperty('Height'); << Enter Height of RectangleB to BHeight. RectangleB.setProperty('Height', BHeight-70); << Save Height of RectangleB to BHeight+100.
|
|
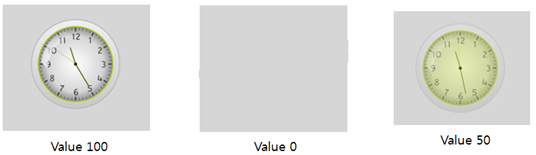
Opacity is a property about the transparency of graphic objects. ㆍ Obtain transparency of graphic objects. |
※ Objects : Apply tp all graphic objects. |
setProperty( 'Opacity', value:Transparency ) |
Opacity is a property about the transparency of graphic objects. |
ㆍ Enter the transparency value to value. ㆍ value could be 0 to 100, 0 is invisible and 100 is visible. |
※ Object : Apply to all graphic objects. |
Example)
OldClock = canvas.getObject('Clock_1'); val = OldClock.getProperty('Opacity'); << val = 100 OldClock.setProperty('Opacity', 0); << Invisible OldClock.setProperty('Opacity', 50); << Transparency 50
|
|
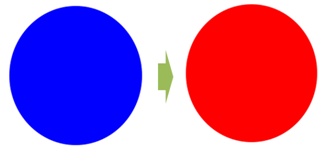
BrushColor is a property about the fill color of graphic objects. ㆍ Obtain the current color. |
※ Objects : Ellipse, Rectangle, Round rectangle, Polygon, Graphic path, Text, Pie, Arc, Button, Pencil. |
setProperty( 'BrushColor', value:Fill color ) |
BrushColor is a property about the fill color of graphic objects. ㆍ Enter the fill color of graphic objects to color. ㆍ Color is entering with QColor(R,G,B) and R,G,B could be 0 to 255. ㆍ If the fill color is a gradation type, the first gradation color is selected. |
※ Objects : Ellipse, Rectangle, Round rectangle, Polygon, Graphic path, Text, Pie, Arc, Button, Pencil |
Example)
Ellipse = canvas.getObject('Ellipse_1'); color = Ellipse.getProperty('BrushColor'); << The value of color is currently QColor(0,0,255). Ellipse.setProperty('BrushColor', QColor(255, 0, 0) ); <<Change the color of the circle to QColor(0,0).
|
The following is an example of changing property if the fill color style is one-color. |
|
Example)
Ellipse = canvas.getObject('Ellipse_1'); color = Ellipse.getProperty('BrushColor'); << The value of color is currently QColor(0,0,255). Ellipse.setProperty('BrushColor', QColor(255, 0, 0) ); << Change the color of the cicle to QColor(255.0.0).
|
The following is an example of changing property if the fill color style is gradation. |
|
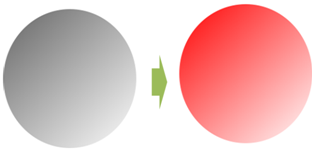
GradationColor is applied only the fill type is a gradation type, and it is a property about the second color. ㆍ Obtain the second color of gradation. |
※ Objects : Ellipse, Rectangle, Round rectangle, Polygon, Graphic path, Text, Pie, Arc, Button, Pencil. |
setProperty( 'GradationColor', color:Three primary colors ) |
GradationColor is a property about the fill type of graphic objects. |
ㆍ Enter the gradation color of graphic objects to color. ㆍ color is entering with QColor(R,G,B), and R,G,B could be 0 to 255. ㆍ If the fill type is gradation, the changing color uses BrushColor and GradationColor. |
※ Objects : Ellipse, Rectangle, Round rectangle, Polygon, Graphic path, Text, Pier, Arc, Button, pencil |
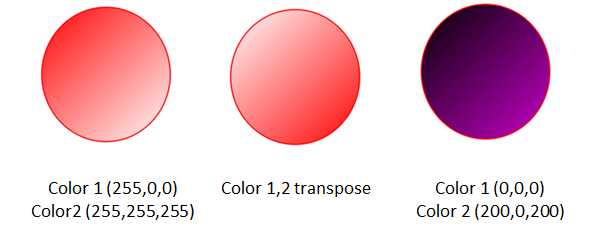
Example)
Ellipse = canvas.getObject('Ellipse_1'); color1 = Ellipse.getProperty('BrushColor'); << Obtain the brush color of ellipse on color1. color2 = Ellipse.getProperty('GradationColor'); << Obtain the gradation color of ellipse on color2. Ellipse.setProperty('BrushColor', color2 ); << Set the brush color to color2. Ellipse.setProperty('GradationColor', color1 ); << Set the gradation color to color1.
Ellipse.setProperty('BrushColor', QColor(0, 0, 0) ); << Set the brush color to QColor(0,0,0). Ellipse.setProperty('GradationColor', QColor(200, 0, 200) ); << Set the gradation color to QColor(200,0,200).
|
|
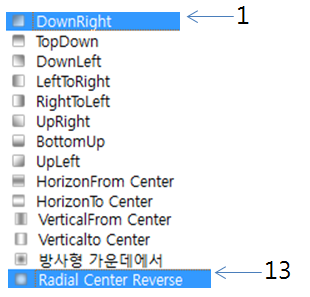
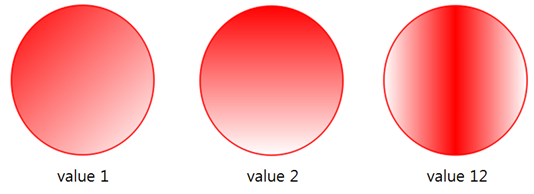
If the fill type is gradation, GradationType is a property about gradation types. ㆍ Obtain the current gradation type. |
※ Objects : Ellipse, Rectangle, Round rectangle, Polygon, Graphic path, Text, Pie, Arc, Button, Pencil |
setProperty( 'GradationType', color:Three primary colors ) |
If the fill type is gradation, GradationType is a property about gradation types. |
ㆍ Enter the fill type to value. ㆍ Gradation type |
※ Objects : Ellipse, Rectangle, Round rectangle, Polygon, Graphic path, Text, Pie, Arc, Button, Pencil |
Example)
Ellipse = canvas.getObject('Ellipse_1'); val = Ellipse.getProperty('GradationType'); Ellipse.setProperty('GradationType', 2 ); Ellipse.setProperty('GradationType', 12 );
|
|
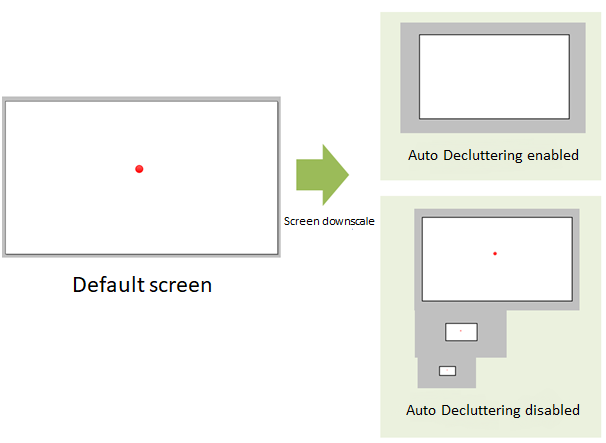
If the fill type is gradation, Auto Decluttering is a property about gradation types. ㆍ Obtain the current gradation type. |
※ Objects : Ellipse, Rectangle, Round rectangle, Polygon, Graphic path, Text, Pie, Arc, Button, Pencil. |
setProperty( 'Auto Decluttering', value:Screen reduction ) |
Auto Decluttering is a property whether it displays graphic objects when minimizing the screen. |
ㆍ value : 0 Do not apply Auto Decluttering. Objects are displayed despite reducing the screen. ㆍ value : 1 Apply Auto Decluttering. Objects are not displayed when minimizing the screen. |
※ Objects : Ellipse, Rectangle, Round rectangle, Polygon, Graphic path, Text, Pie, Arc, Button, Pencil |
Example)
lamp = canvas.getObject('lamp_red_1'); lamp.setProperty('Auto Decluttering', 0 ); << Do not apply Auto Decluttering lamp.setProperty('Auto Decluttering', 1 ); << Apply Auto Decluttering
|
|
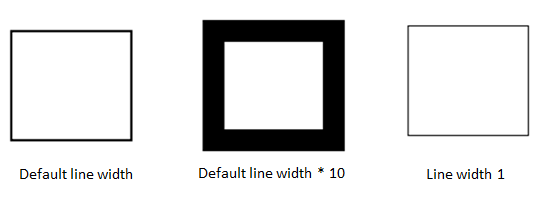
PenWidth is a property about the line width of graphic objects. |
※ Objects : Ellipse, Rectangle, Round rectangle, Polygon, Line, Connection, Bezier curve , Graphic path, Text, Pie, Arc, Pencil |
setProperty( 'PenWidth', value:Line width ) |
PenWidth is a property about the line width of graphic objects. |
ㆍ Enter the line width of graphic objects to value. |
※ Objects : Ellipse, Rectangle, Round rectangle, Polygon, Line, Connection, Bezier curve, Graphic path, Text, Pie, Arc, Pencil |
Example)
Obj = canvas.getObject('Rectangle'); val = Obj.getProperty('PenWidth'); << Obtain the current line width and enter it to val. Obj.setProperty('PenWidth', val * 10 ); << Set the line widt as val*10. Obj.setProperty('PenWidth', 1 ); << Set the line width as 1.
|
|
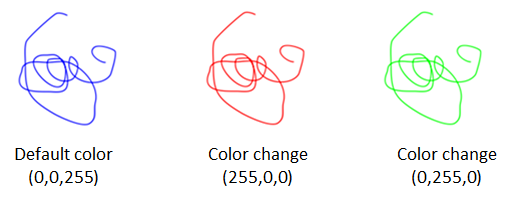
PenColor is a property about the line color of graphic objects. |
※ Objects : Ellipse, Rectangle, Round rectangle, Polygon, Line, Connection, Bezier curve, Graphic path, Text, Pie, Arc, Pencil |
setProperty( 'PenColor', color:Three primary colors ) |
PenColor is a property about the line color of graphic objects. |
ㆍ Enter the line width of graphic objects to color. ㆍ color is entering with QColor(R,G,B), and R,G,B could be 0 to 255. |
Objects : Ellipse, Rectangle, Round rectangle, Polygon, Line, Connection, Bezier curve, Graphic path, Text, Pie, Arc, Pencil |
Example)
Obj = canvas.getObject('Path'); val = Obj.getProperty('PenColor'); Obj.setProperty('PenColor', QColor(255,0,0) ); Obj.setProperty('PenColor', QColor(0, 255,0) );
|
|
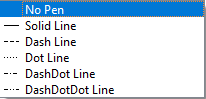
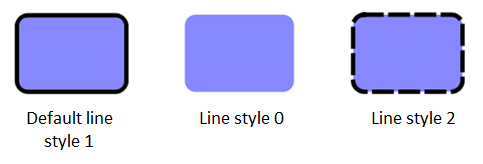
PenStyle is a property about the line type of graphic objects. |
※ Objects : Ellipse, Rectangle, Round rectangle, Polygon, Line, Connection, Bezier curve, Graphic path, Text, Pie, Arc, Pencil |
setProperty( 'PenStyle, value:Line type ) |
PenColor is a property about the line color of graphic objects. |
ㆍ The line type is entered on value Enter the line type to value. ㆍ Line Type |
※ Objects : Ellipse, Rectangle, Round rectangle, Polygon, Line, Connection, Bezier curve, Graphic path, Text, Arc, Pie, Pencil |
Example)
Obj = canvas.getObject('Path'); val = Obj.getProperty(‘PenStyle'); Obj.setProperty(‘PenStyle', 0 ); << The line will disappear. Obj.setProperty('PenStyle’, 2 );
|
|
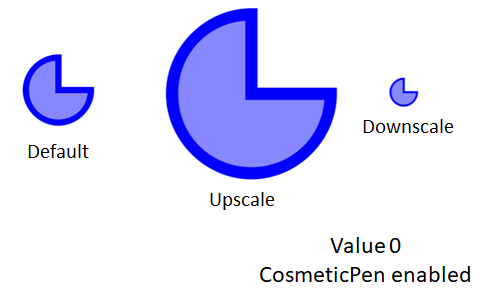
CosmeticPen is a property that the changing like the line width depending on the window. |
※ Objects : Ellipse, Rectangle, Round rectangle, Line, Connection, Bezier curve, Graphic path, Text, Pie, Arc, Pencil |
setProperty( 'CosmeticPen', value:Width change ) |
CosmeticPen is a property that the changing like the line width depending on the window. |
ㆍ If value is 0, it changes despite the window. ㆍ If value is 1, it holds its properties. |
※ Objects : Ellipse, Rectangle, Round rectangle, Line, Connection, Bezier curve, Graphic path, Text, Pie, Arc, Pencil |
Example)
Obj = canvas.getObject('Pie'); val = Obj.getProperty('CosmeticPen'); Obj.setProperty('CosmeticPen', 0 ); Obj.setProperty('CosmeticPen', 1 );
|
|

FaceText is a property about the text displayed on graphic objects. |
※ Objects : Ellipse, Rectangle, Round rectangle, Polygon, Text, Pie, svg |
setProperty( 'FaceText', value:String or Number ) |
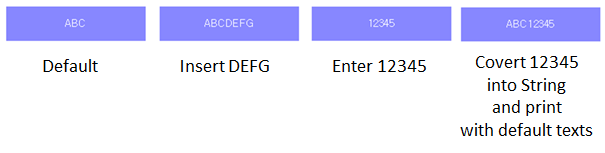
FaceText is a property about the text displayed on graphic objects. |
ㆍ Enter String and numbers to value. ㆍ Mixing String and Number is not available. |
※ Objects : Ellipse, Rectangle, Round rectangle, Polygon, Text, Pie, svg |
Example)
Obj = canvas.getObject('Text'); val = Obj.getProperty('FaceText'); << Obtain String of text. Obj.setProperty('FaceText', val + 'DEFG' ); << Add DEFG to the obtained String and print it. Obj.setProperty('FaceText', 12345 ); << Enter 12345. Obj.setProperty('FaceText', val + 12345 ); << The obtained String and numbers are not mixing. val + 12345 or String + 12345 is an error. Obj.setProperty('FaceText', val + str(12345) ); << Change numbers into String and print it.
|
|
FaceColor is a property about the text color of graphic objects. |
※ Objects : Ellipse, Rectangle, Round rectangle, Polygon, Text, Pie, svg |
setProperty( 'FontColor', color:Three primary colors ) |
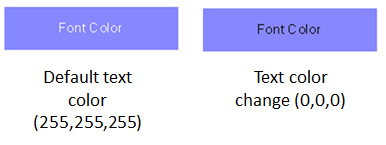
FaceColor is a property about the text color of graphic objects. |
ㆍ The line width is entered on color. Enter the line width to color. ㆍ color is entering with QColor(R,G,B), and R,G,B could be 0 to 255. |
※ Objects : Ellipse, Rectangle, Round rectangle, Polygon, Text, Pie, svg |
Example)
Obj = canvas.getObject('Text'); color = Obj.getProperty('FontColor'); Obj.setProperty('FontColor', QColor(0, 0, 0) );
|
|
Example)
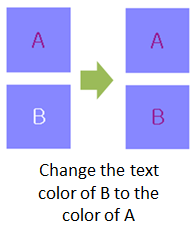
Obj_A = canvas.getObject('A'); Obj_B = canvas.getObject('B'); colorA = Obj_A.getProperty('FontColor'); << Enter the font color of A to colorA. Obj_B.setProperty('FontColor', colorA ); << Set the font color of B as colorA
|
|
FontSize is a property about the font size of graphic objects. |
※ Objects : Ellipse, Rectangle, Round rectangle, Polygon, Text, Pie, svg |
setProperty( 'FontSize', value:Number ) |
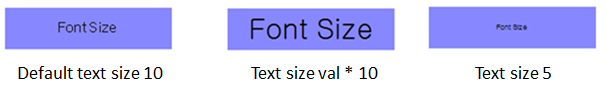
FontSize is a property about the font size of graphic objects. |
ㆍ Enter the font size of graphic objects to value. |
※ Objects : Ellipse, Rectangle, Round rectangle, Polygon, Text, Pie, svg |
Example)
Obj = canvas.getObject('Text'); val = Obj.getProperty('FontSize'); Obj.setProperty('FontSize', val * 2 ); Obj.setProperty('FontSize', 5 );
|
|
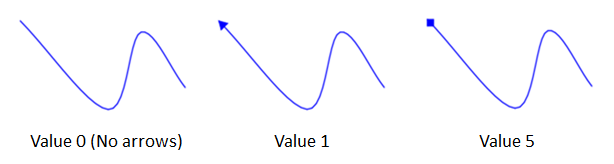
ArrowHead is a property about the arrow type of graphic objects. |
※ Objects : Ellipse, Rectangle, Round rectangle, Polygon, Text, Pie, svg |
setProperty( 'ArrowHead', value:Numbers ) |
ArrowHead is a property about the arrow type of graphic objects. |
ㆍ Enter the arrow head type to value. ㆍ Arrow type |
※ Objects : Line, Connection, Bezier curve. |
Example)
Obj = canvas.getObject('Spline'); val = Obj.getProperty('ArrowHead'); Obj.setProperty('ArrowHead', 1); Obj.setProperty('ArrowHead', 5);
|
|

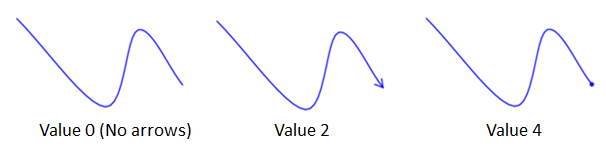
ArrowTail is a property about the arrow type of graphic objects. |
※ Objects : Ellipse, Rectangle, Round rectangle, Polygon, Text, Pie, svg |
setProperty( 'ArrowTail', value:Numbers ) |
ArrowTail is a property about the arrow type of graphic objects. |
ㆍ Enter the arrow tail type to value. ㆍ Arrow type |
※ Objects : Line, Connection, Bezier curve |
Example)
Obj = canvas.getObject('Spline'); val = Obj.getProperty(‘ArrowTail’); Obj.setProperty('ArrowTail', 2); Obj.setProperty('ArrowTail', 4);
|
|
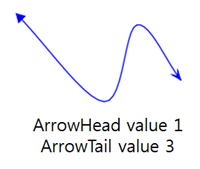
Example)
Obj = canvas.getObject('Spline'); Obj.setProperty('ArrowHead', 1); Obj.setProperty('ArrowTail', 3);
|
|

Speed is a property about the play rate of GIF animations. |
※ Object : GIF animation |
setProperty( 'Speed', value:Numbers ) |
Speed is a property about the play rate of GIF animations. |
ㆍ Enter the play rate of GIF animations to value. ㆍ The default is 100. |
※ Object : GIF animation |
Example)
Obj = canvas.getObject('GIF'); val = Obj.getProperty(‘Speed’); Obj.setProperty(‘Speed’, 100); Obj.setProperty(‘Speed’, 50); Obj.setProperty(‘Speed’, 200);
|
Run is a property about the play of GIF animations |
※ Object : GIF animation |
setProperty( 'Run', value:Numbers ) |
Run is a property about the play of GIF animations. |
ㆍ value 0 means not running, and value 1 means running. |
※ Object : GIF animation |
Example)
Obj = canvas.getObject('GIF'); val = Obj.getProperty(‘Run’); Obj.setProperty(‘Run’, 1); << Play Obj.setProperty(‘Run’, 0); << Stop
|
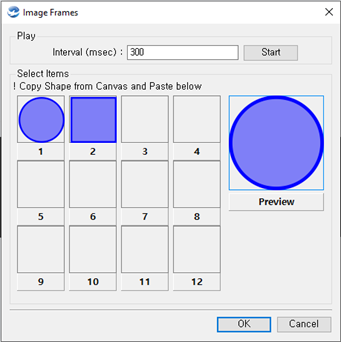
Play is a property about the playing of image frames. |
※ Object : Image frames |
setProperty( 'Play', value:Numbers ) |
Play is a property about the playing of image frames. |
ㆍ value 1 means running, and value 0 means not running. |
※ Object : Image frames |
Example)
Obj = canvas.getObject('Image Frame'); val = Obj.getProperty(‘Play’); Obj.setProperty(‘Play’, 1); << Play Obj.setProperty(‘Play’, 0); << Stop
|
Interval is a property about play speed of image frames. |
※ Objects : Image frames |
setProperty( 'Interval', value:Numbers ) |
Interval is a property about play speed of image frames. |
ㆍ Display image frames on the screen at the interval of msec. ㆍ The default is 300. |
※ Object : Image frames |
Example)
Obj = canvas.getObject('GIF'); val = Obj.getProperty(‘Speed’); Obj.setProperty(‘Speed’, 300); << The frame is changing at every 0.3 second. Obj.setProperty(‘Speed’, 5000); << The frame is changing at every 5 seconds
|
|
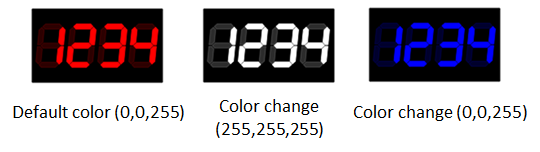
LED Color is a property about the color of 7Segment. |
※ Object : 7Segment |
setProperty( 'LED Color', color:Three primary colors ) |
LED Color is a property about the color of 7Segment. |
ㆍ Enter the color of graphic objects to color. ㆍ color is entering with QColor(R,G,B), and R,G,B could be 0 to 255. |
※ Object : 7Segment |
Example)
Obj = canvas.getObject( '7Segment' ); color = Obj.getProperty( 'LED Color'); Obj.setProperty('LED Color', QColor( 255, 255, 255 ) ); Obj.setProperty('LED Color', QColor( 0, 0, 255 ) );
|
|
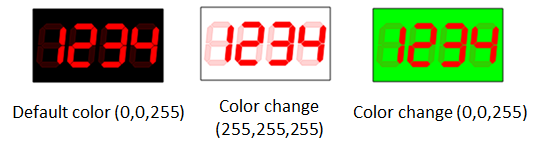
Background Color is a property about the color of the background which printing on 7Segment. |
※ Object : 7Segment |
setProperty( 'Background Color', color:Three primary colors ) |
Background Color is a property about the color of the background which printing on 7Segment. |
ㆍ Enter the color of the background to color. ㆍ color is entering with QColor(R,G,B), and R,G,B could be 0 to 255. |
※ Object : 7Segment |
Example)
Obj = canvas.getObject( '7Segment' ); color = Obj.getProperty( 'Background Color'); Obj.setProperty('Background Color', QColor( 255, 255, 255 ) ); Obj.setProperty('Background Color', QColor( 0, 255, 0 ) );
|
|
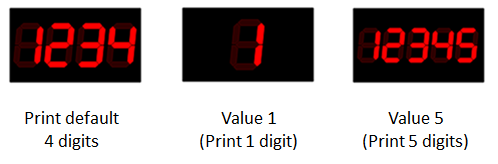
Digit Count is a property about the unit of numbers that printing on 7Segment. |
※ Object : 7Segment |
setProperty( 'Digit Count', value:Numbers ) |
Digit Count is a property about the unit of numbers that printing on 7Segment. ㆍ The unit is changed based on value. |
※ Object : 7Segment |
Example)
Obj = canvas.getObject( '7Segment' ); val = Obj.getProperty(‘Digit Count’); Obj.setProperty(‘Digit Count’, 1 ); Obj.setProperty(‘Digit Count’, 5 );
|
|
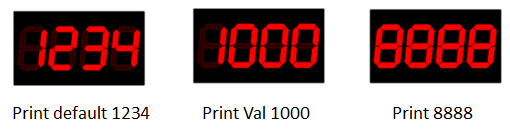
Value is a property about the value of 7Segment and image slider. |
※ Objects : 7Segment, Image button, Image slider |
setProperty( 'Value', value:Numbers ) |
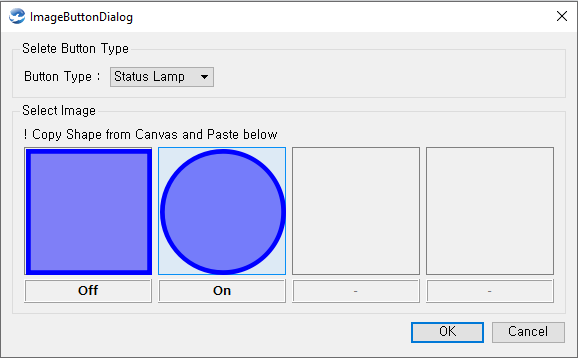
Value is a property about the value of 7Segment and image slider. ㆍ In the image button, 0 and 1 represent the state of buttons. ㆍ 0 is Off, 1 is On. |
※ Objects : 7Segment, Image button, Image slider. |
Example)
Obj = canvas.getObject( '7Segment' ); val = Obj.getProperty(‘Value’); val = 1000; Obj.setProperty('Value’, val ); Obj.setProperty('Value’, 8888 );
|
|
Example)
Obj = canvas.getObject( 'ImageButton' ); val = Obj.getProperty(‘Value’); Obj.setProperty('Value’, 0 ); Obj.setProperty('Value’, 1 ); |
|
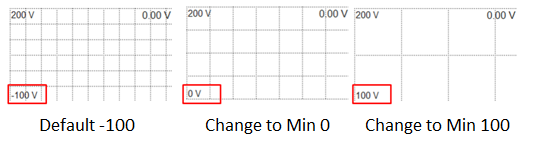
Min is a property about the minimum value of images. |
※ Obejcts : Image slider, SimpleGraph, TrandGraph. |
setProperty( 'Min', value:Numbers ) |
Min is a property about the minimum value of images. ㆍ Set the lower limit with value. |
※ Objects : Image slider, SimpleGraph, TrandGraph |
Example)
Obj = canvas.getObject( 'SimpleGraph_1' ); val = Obj.getProperty( 'Min'); Obj.setProperty('Min', 0 ); Obj.setProperty('Min', 100 );
|
|
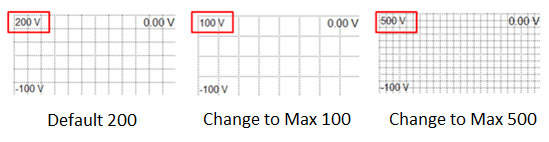
Max is a property about the maximum value of images. |
※ Objects : Image slider, SimpleGraph, TrandGraph. |
setProperty( 'Max', value:Numbers ) |
Max is a property about the maximum value of images. ㆍ Set the upper limit with value. |
※ Objects : Image slider, SimpleGraph, TrandGraph |
Example)
Obj = canvas.getObject( 'SimpleGraph_3' ); val = Obj.getProperty( 'Max'); Obj.setProperty('Max', 100 ); Obj.setProperty('Max', 500 );
|
|
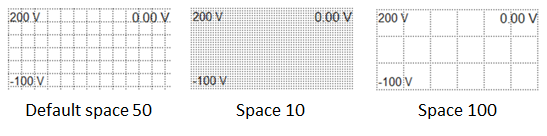
GridWidth is a property about the gap between grids. |
※ Object : SimpleGraphic Object |
setProperty( 'GridWidth', value:Numbers ) |
GridWidth is a property about the gap between grids, ㆍ Enter the gap to value. |
※ Object : SimpleGraph |
Example)
Obj = canvas.getObject( 'SimpleGraph' ); val = Obj.getProperty(‘GridWidth’); Obj.setProperty(‘GridWidth’, 10 ); Obj.setProperty(‘GridWidth’, 100 );
|
|
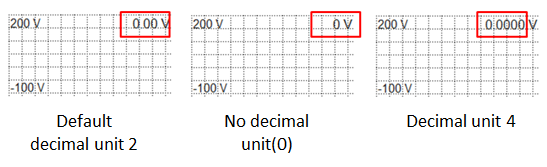
Demicals is a property about the decimal count of SimpleGraph values. |
※ Object : SimpleGrap |
setProperty( 'Demicals', value:Numbers ) |
Demicals is a property about the decimal count of SimpleGraph values. ㆍ Enter the decimal count to value. |
※ Object : SimpleGraph Objects |
Example)
Obj = canvas.getObject( ‘Demicals' ); val = Obj.getProperty(‘Demicals’); Obj.setProperty(‘Demicals’, 0 ); Obj.setProperty(‘Demicals’, 4 );
|
|
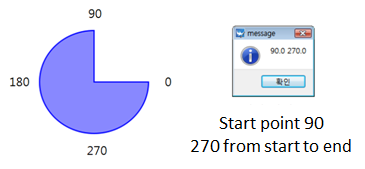
startAngle is a property about the starting point angle of graphic objects. |
※ Object : Pie |
setProperty( 'startAngle', value:Numbers ) |
startAngle is a property about the starting point angle of graphic objects. ㆍ Enter the starting point angle to value. ※ Object : Pie |
spanAngle is a property about the endpoint angle of graphic objects. ※ Object : Pie |
setProperty( 'spanAngle', value:Numbers ) |
spanAngle is a property about the endpoint angle of graphic objects. ㆍ Enter the endpoint angle to value. ※ Object : Pie |
Example)
Obj = canvas.getObject( 'Pie' ); Start = Obj.getProperty(‘startAngle’); End = Obj.getProperty(‘spanAngle’); app.messageBox(str(a) + ' ' + str(b) );
|
|
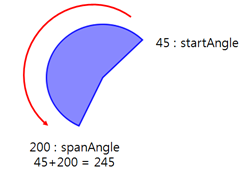
Example)
Obj = canvas.getObject( 'Pie' ); Obj.setProperty(‘startAngle’, 45); << Set the start angle as 45. Obj.setProperty(‘spanAngle’, 200); << Set the end angle as start angle + 200. (45+200=245)
|
|
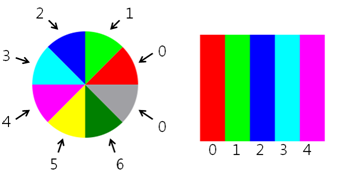
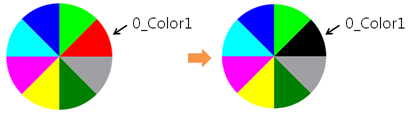
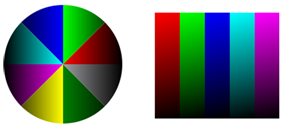
_Color1 is a property about the color 1 of multi-color expression objects. It is applied to enter numbers in front of _Color1. ㆍ Pie chart applys from 0 to 7. and Ratio bar applys from 0 to 4. ㆍ The location is different based on numbers. ㆍ color is entering by QColor. ㆍ If a gradation is not applied to the property, the color applied to _Color1 represents in one color. ㆍ Example) setProperty(‘0_Color1’, QColor( 255, 0, 0) ) setProperty(‘5_Color1’, QColor( 255, 0, 0) ) setProperty(‘8_Color1’, QColor( 255, 0, 0) ) ※ Objects : Pie chart, Ratio bar. This is the basic location based on numbers. |
|
Example)
Obj = canvas.getObject( 'Pie chart_1' ); Obj.setProperty( ‘0_Color1’, QColor(0, 0, 0) );
|
|
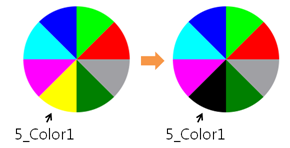
Example)
Obj = canvas.getObject( 'Pie chart_1' ); Obj.setProperty( ‘5_Color1’, QColor(0, 0, 0) );
|
|
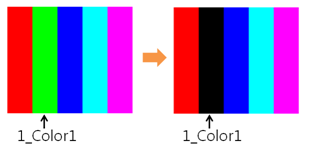
Example)
Obj = canvas.getObject( 'Ratio bar_1' ); Obj.setProperty( ‘1_Color1’, QColor(0, 0, 0) ); |
|
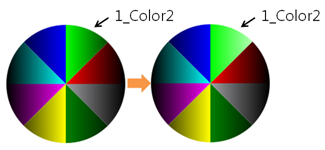
_Color2 is a property about the color 2 of multi color expression objects. It is applied to enter numbers in front of _Color2. ㆍ Pie chart is applied from 0 to 7, and the ratio bar is applied from 0 to 4. ㆍ The location is different based on numbers. ㆍ color is entering by QColor. ㆍ If a gradation is applied to the property, _Color1 is a start color, and _Color2 is an end color. It is represented in gradation color. ㆍ If a gradation is not applied to the property, _Color2 does not happen to the screen. ㆍ Example) setProperty(‘0_Color2’, QColor( 255, 0, 0) ) setProperty(‘5_Color2’, QColor( 255, 0, 0) ) setProperty(‘8_Color1’, QColor( 255, 0, 0) ) ※ Objects : Pie chart, Ratio bar This is the default of gradations. |
|
Example)
Obj = canvas.getObject( 'Pie chart_1' ); Obj.setProperty( ‘1_Color2’, QColor(255, 255, 255) );
|
|
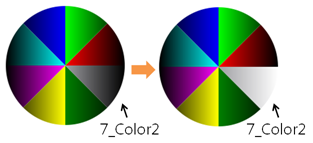
Example)
Obj = canvas.getObject( 'Pie chart_1' ); Obj.setProperty( ‘7_Color2’, QColor(255, 255, 255) );
|
|
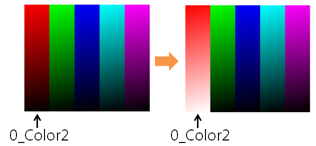
Example)
Obj = canvas.getObject( 'Ratio bar_1' ); Obj.setProperty( ‘0_Color2’, QColor(255, 255, 255) ); |
|
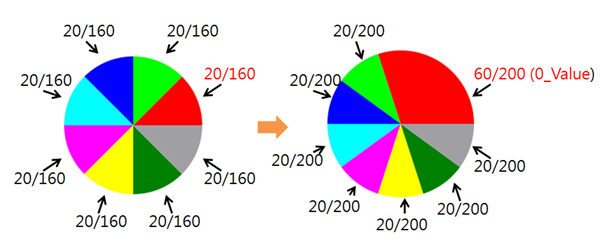
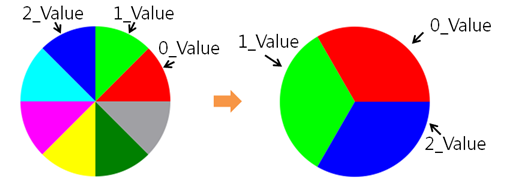
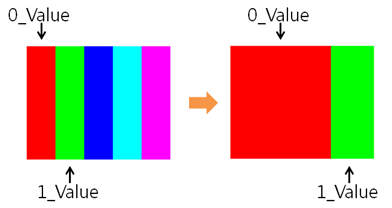
_Value is a property about the graphic area of multi color expression objects. It is applied to enter numbers in front of _Value. ㆍ Pie chart is applied from 0 to 7, and the ratio bar is applied from 0 to 4. ㆍ The location is different based on numbers. ㆍ Enter the Integer number to value. The default is 20.00. ㆍ The drawing area changes according to value. ㆍ It is drawn according to the value of each area by the sum of the total area. ※ Objects : Pie chart, Ratio bar |
Example)
Obj = canvas.getObject( 'Pie chart_1' ); Obj.setProperty( ‘0_Value’, 60 );
|
|
ㆍ If the value of 0_Value is 60, the sum of the total area is changed to 200. ㆍ The drawing area is drawn as the ratio of (each area/total area), the area of 0_Value is getting bigger, and other areas are lower as well. |
Example)
Obj = canvas.getObject( 'Pie chart_1' ); Obj.setProperty( ‘0_Value’, 60 ); Obj.setProperty( ‘1_Value’, 60 );. Obj.setProperty( ‘2_Value’, 60 ); Obj.setProperty( ‘3_Value’, 0 ); Obj.setProperty( ‘4_Value’, 0 ); Obj.setProperty( ‘5_Value’, 0 ); Obj.setProperty( ‘6_Value’, 0 ); Obj.setProperty( ‘7_Value’, 0 );
|
|
Example)
Obj = canvas.getObject( 'Ratio bar_1' ); val = scada.getValue(‘Station1.charging); val1 = scada.getValue(‘Station1.discharging); Obj.setProperty( ‘0_Value’, val); Obj.setProperty( ‘1_Value’, val1); Obj.setProperty( ‘2_Value’, 0); Obj.setProperty( ‘3_Value’, 0); Obj.setProperty( ‘4_Value’, 0); |
|
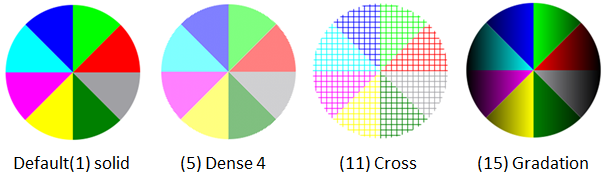
BarBrushStyle is a property about the fill color style of multi color expression objects. ㆍ The default of value is 1. It is one color property. ㆍ value could be 0 to 17. ㆍ Gradation is 16. ※ Objects : Pie chart, Ratio bar |
Example)
Obj = canvas.getObject( ' Pie chart_1' ); Obj.setProperty( ‘BarBrushStyle’, 1 ); << Solid Obj.setProperty( ‘BarBrushStyle’, 5 ); << Dense4 Obj.setProperty( ‘BarBrushStyle’, 11 ); << Cross Obj.setProperty( ‘BarBrushStyle’, 15 ); << Gradation |
|

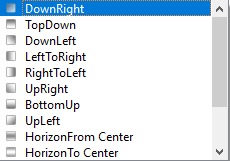
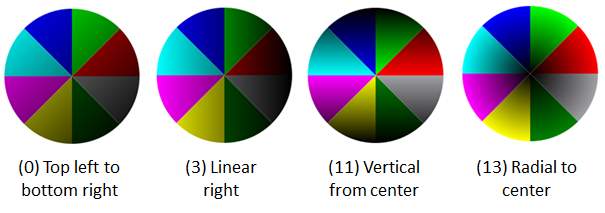
BarGradationType is a property about the gradation of multi color expression objects. ㆍ BarBrushStyle is applied when gradation is set. ㆍ value could be 0 to 13. ※ Objects : Pie chart, Ratio bar. |
Example)
Obj = canvas.getObject( 'Pie chart_1' ); Obj.setProperty( ‘BarGradationType’, 0 ); << Top left to bottom right Obj.setProperty( ‘BarGradationType’, 3 ); << Linear right Obj.setProperty( ‘BarGradationType’, 11 ); << Vertical from center Obj.setProperty( ‘BarGradationType’, 13 ); << Radial to center |
|
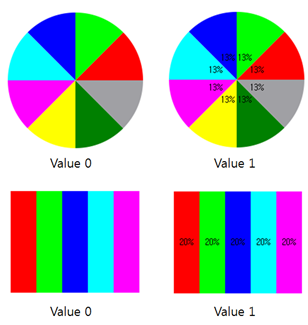
DisplayValue is a property about displaying the value of multi color expression objects. ㆍ value would be set TRUE / FALSE (1/0), if 0 displays noting, and if 1 displays values. ㆍ The value displays the ratio of (current value/total value), which the value by _Value does not. ※ Objects : Pie chart, Ratio bar |
Example)
Obj = canvas.getObject( 'Pie chart_1' ); Obj.setProperty( ‘DisplayValue’, 0 ); Obj.setProperty( ‘DisplayValue’, 1 ); Obj1 = canvas.getObject( 'Ratio bar_1' ); Obj1.setProperty( ‘DisplayValue’, 0 ); Obj1.setProperty( ‘DisplayValue’, 1 ); |
|
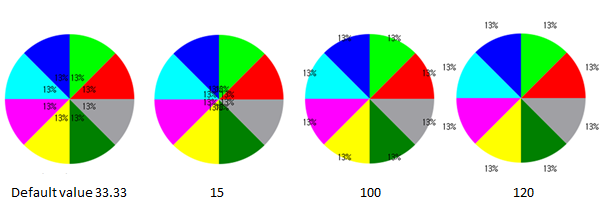
TextPosition is a property about the value position of multi color expression objects. ㆍ TextPosition supports only the pie chart. ㆍ value is the center axis, 100 is an exterior anlge of the circle. ㆍ The default of value is set as 33.33 ㆍ Ratio bar is not supported. ※ Object : Pie chart |
Example)
Obj = canvas.getObject( 'Pie chart_1' ); Obj.setProperty( ‘TextPosition’, 15 ); Obj.setProperty( ‘TextPosition’, 100 ); Obj.setProperty( ‘TextPosition’, 120 ); |
|
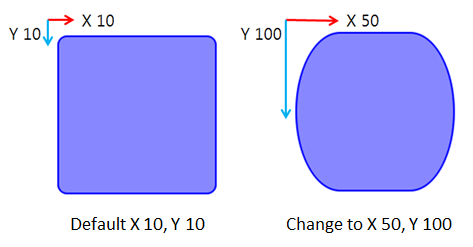
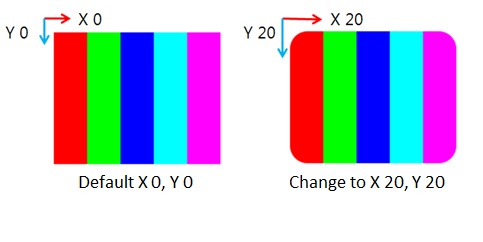
RoundX is a property about the X-axis position of edges. ㆍ Set the shape of edges as a curve from the vertex to value(X-axis). ㆍ In the round rectangle, the default of value is 10, the default of ratio bar is 0. |
※ Objects : Round rectangle, Ratio bar |
RoundY is a property about the Y-axis position of edges. ㆍ Set the shape of edges as a curve from the vertex to value(Y-axis). ㆍ In the round rectangle, the default of value is 10, the default of ratio bar is 0. |
※ Objects : Roung rectangle, Ratio bar |
Example)
rect = canvas.getObject( 'RoundedRect_1' ); rect.setProperty( ‘RoundX’, 50 ); rect.setProperty( ‘RoundY’, 100 );
|
|
Example)
bar = canvas.getObject( 'Ratio bar_1' ); bar.setProperty( ‘RoundX’, 20 ); bar.setProperty( ‘RoundY’, 20 ); |
|