Text Table*
Text Table
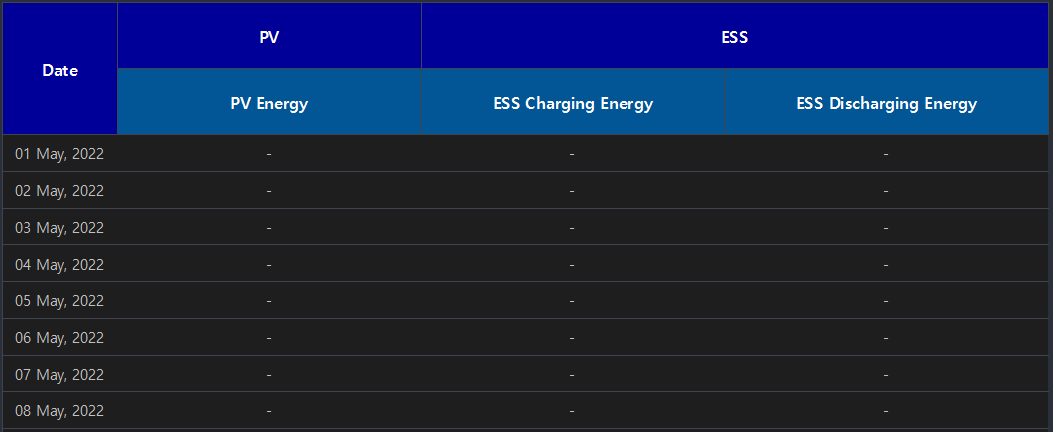
 Text table is a graphical object responsible for the table function.
The difference between grid widget is
- Grid widget sets UI tasks such as the cell size setting, merging, and color changing with using scripts.
- Text table can be designed in PowerScene studio.
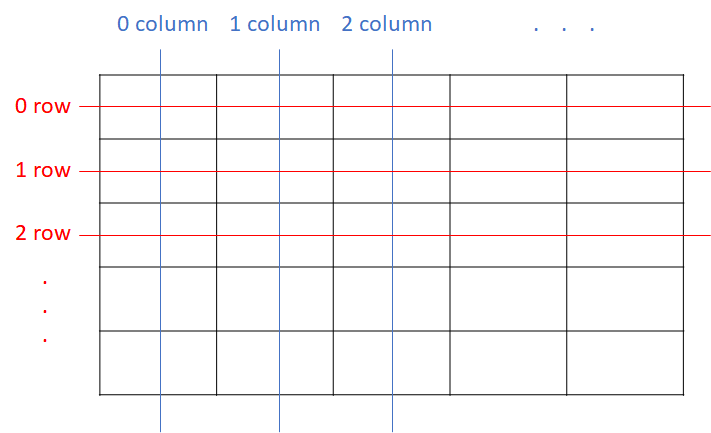
Text table selects the location of cells by entering rows and columns like the grid widget.
Methods
Text table provides the following scripts.
Return Type |
Method |
Description |
variant |
Read the set data of cells by entering rows and columns. |
|
color |
Return the background color of cells by entering rows and columns. |
|
color |
Return the line color of cells by entering rows and columns. |
|
str |
Read the text displayed on cells. |
|
color |
Return the text color by entering rows and columns. |
|
Delete the data set by setGridData. |
||
clearText( startRow, rowCount, startColumn, columnCount ) |
Remove the text of that cell by selecting the cell area. |
|
int |
Read the number of columns. |
|
connect( eventName, func ) |
Register an event handler of the text table widget. |
|
int |
Return the current page. |
|
Print the next data based on the current page. |
||
Print the previous data based on the current page. |
||
int |
Read the number of rows. |
|
list[str] |
Read all of text from the selected row. |
|
setCellData( row, column ) |
Set the data of cells by entering rows and columns. |
|
setCellFillColor( row, column, color ) |
Set the background color of cells by entering rows and columns. |
|
setCellLineColor( row, column, color ) |
Set the line color of cells by entering rows and columns. |
|
setCellText( row, column, text ) |
Set the text of cells by entering rows and columns. |
|
setCellTextColor( row, column, color ) |
Set the text color of cells by entering rows and columns. |
|
setCellClickable( row, column, clickable ) |
Set whether the cell is clickable by entering rows and columns. |
|
setCellStyle( row, column, style ) |
Set the style of cells by entering rows and columns. |
|
setClickable( clickable ) |
Set whether all of cell is clickable. |
|
setDisplaySelection( enable ) |
Set whether the cell is selectable. |
|
setGridData( startRow,startColumn,rowCount,columnCount , datas) |
Print the data on the selected location. If the number of data exceeded the number of rows, it is able to refer through pages. |
|
int |
Return the size of the total pages. |
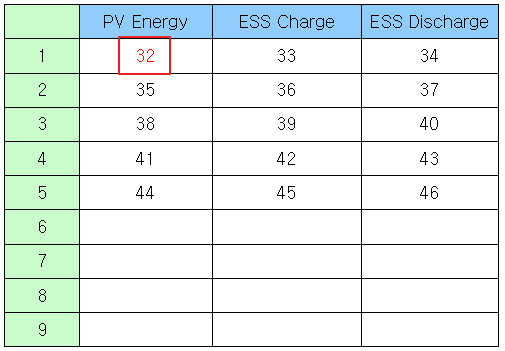
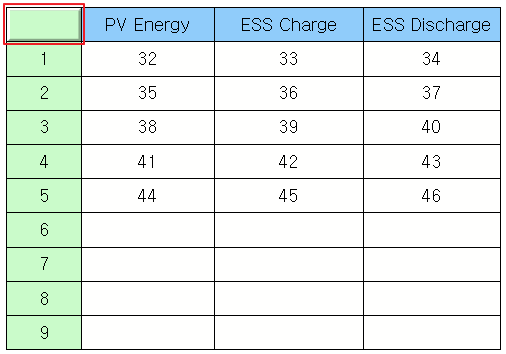
Read the text displayed on the cell. Example)
obj = canvas.getObject('Text Table') # Obtain the text table widget object. text = obj.cellText(0, 1) # Read the text on (0,1). print text |
Output)
PV Energy |
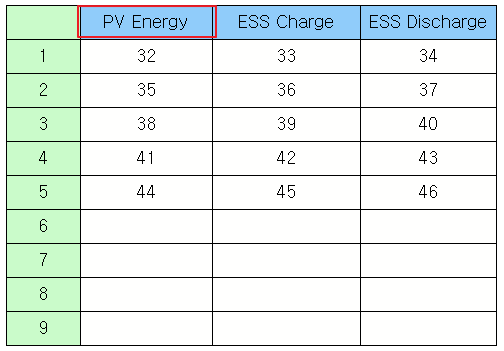
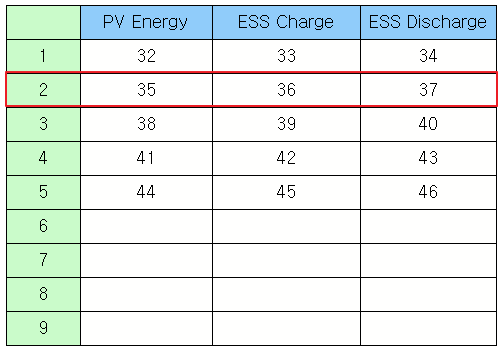
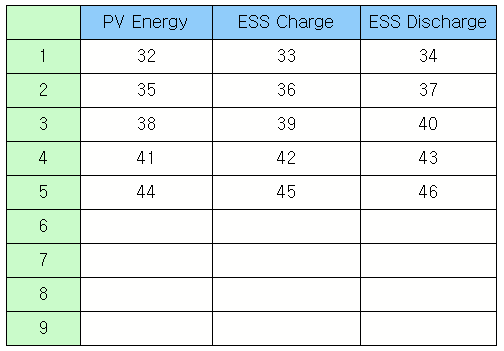
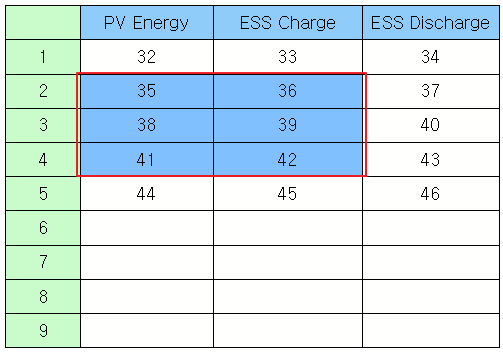
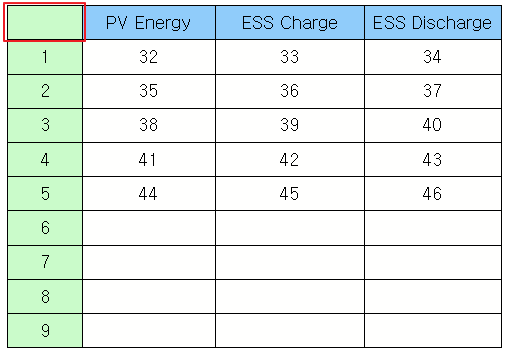
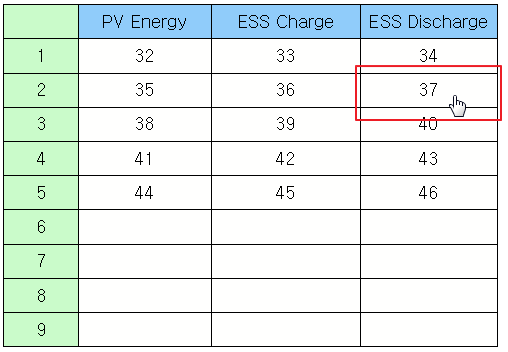
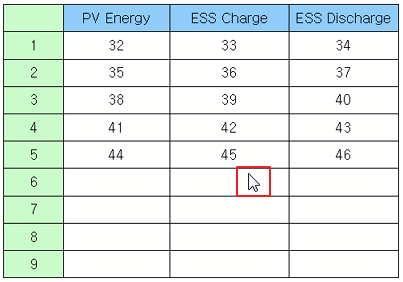
Read the text of the selected row as a list. Example)
obj = canvas.getObject('Text Table') # Obtain the text table widget object. print obj.rowTexts(2) # Read the text of the second row as a list. |
Output)
(u'2', u'35', u'36', u'37') |
Read the number of rows. Example)
obj = canvas.getObject('Text Table') # Obtain the text table widget object. print obj.rowCount() # Read the number of rows.
|
Output)
10 |
Read the number of columns. Example)
obj = canvas.getObject('Text Table') # Obtain the text table widget object. print obj.columnCount() # Read the number of columns.
|
Output)
4 |
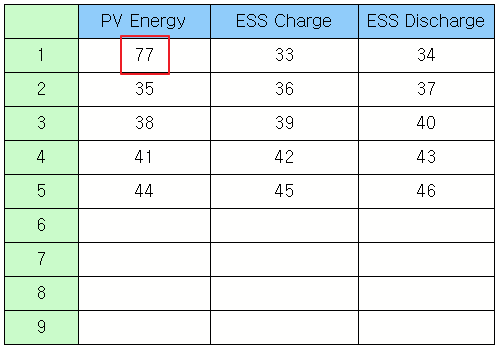
Set the text of cells by entering rows and columns.
Example)
obj = canvas.getObject('Text Table') # Obtain the text table widget object. obj.setCellText(1, 1, '77') # Set '77' to the (1,1)
|
|
setCellTextColor sets the color of the text displayed on cells by entering rows and columns. ㆍ row: Enter rows. ㆍ column: Enter columns. ㆍ color: Enter the text color using the QColor object. QColor object has to be set RGB color values and transparency values. Each value is an Integer number between 0 to 255. QColor object is used as follows. ㆍ Function QColor(red,green,blue,transparency) ㆍ Use example - Red: QColor(255,0,0,255) - Green: QColor(0,255,0,128) - Bluet: QColor(0,0,255,255) Example)
obj = canvas.getObject('Text Table') # Obtain the text table widget object. obj.setCellTextColor(1, 1, QColor(255,0,0,255)) # Change the text color of (1,1) to QColor(255,0,0,255).
|
|
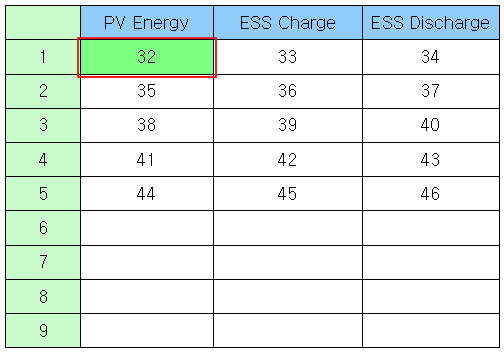
setCellFilColor sets the background color of cells by entering rows and columns. ㆍ row: Enter rows. ㆍ column: Enter columns. ㆍ color: Enter the color using the QColor object. QColor object has to be set RGB color values and transparency values. Each value is an Integer number between 0 to 255. QColor object is used as follows. ㆍ Function QColor(red,green,blue,transparency) ㆍ Use example - Red: QColor(255,0,0,255) - Green: QColor(0,255,0,128) - Blue: QColor(0,0,255,255) Example)
obj = canvas.getObject('Text Table') # Obtain the text table widget object. obj.setCellFillColor(1, 1, QColor(0,255,0,128)) # Change the background color of (1,1) to QColor(0,255,0,128).
|
|
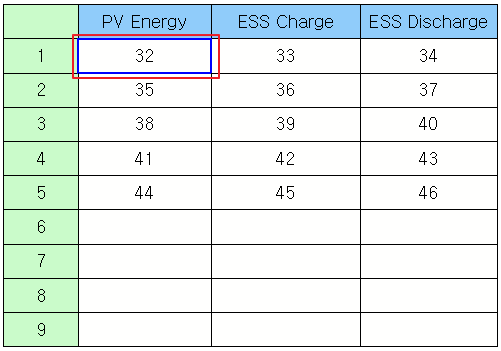
setCellLineColor sets the line color of cells by entering rows and columns. ㆍ row: Enter rows. ㆍ column: Enter columns. ㆍ color: Enter the line color using the QColor object. QColor object has to be set RGB color values and transparency values. Each value is an Integet number between 0 to 255. QColor object is used as follows. ㆍ Function QColor(red,green,blue,transparency) ㆍ Use example - Red: QColor(255,0,0,255) - Green: QColor(0,255,0,128) - Blue: QColor(0,0,255,255) Example)
obj = canvas.getObject('Text Table') # Obtain the text table widget object. obj.setCellLineColor(1, 1, QColor(0,0,255,255)) # Change the line color of (1,1) to QColor(0,0,255,255).
|
|
cellTextColor returns the text color of cells by entering rows and columns. ㆍ row: Enter rows. ㆍ column: Enter columns. Example)
obj = canvas.getObject('Text Table') # Obtains the text table widget object. obj.cellTextColor(1, 1) # Return the text color of (1,1).
|
cellFillColor returns the background color of cells by entering rows and columns. ㆍ row: Enter rows. ㆍ column: Enter columns. Example)
obj = canvas.getObject('Text Table') # Obtain the text table widget object. obj.cellFillColor(1, 1) # Return the background color of (1,1).
|
cellLineColor returns the line color of cells by entering rows and columns. ㆍ row: Enter rows. ㆍ column: Enter columns. Example)
obj = canvas.getObject('Text Table') # Obtain the text table widget object. obj.cellLineColor(1, 1) # Return the line color of (1,1).
|
setDisplaySelection sets whether the cell is selectable. ㆍ enable: Enter 0 or 1. - If 1 is entered, the cell is selectable. - If 0 is entered, the cell is not selectable. Example)
obj = canvas.getObject('Text Table') # Obtain the text table widget object. obj.setDisplaySelection(1) # Set the cell being selectable.
|
|
setClickable sets whether all of the cell is clickable. ㆍ clickable: Enter 0 or 1. - If 1 is entered, all of the cell is clickable. - If 0 is entered, none of the cell is clickable. Example)
obj = canvas.getObject('Text Table') # Obtain the text table widget object. obj.setClickable(1) # Set all of cell is clickable.
|
Example)
obj = canvas.getObject('Text Table') # Obtain the text table widget object. obj.setClickable(0) # Set none of cell is clickable.
|
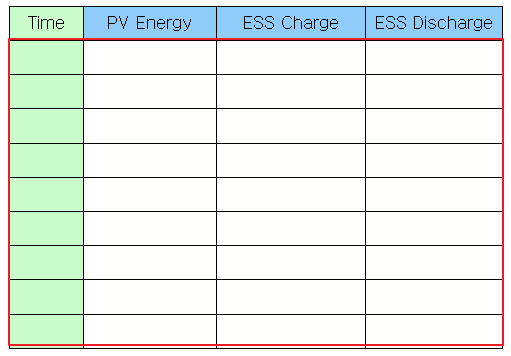
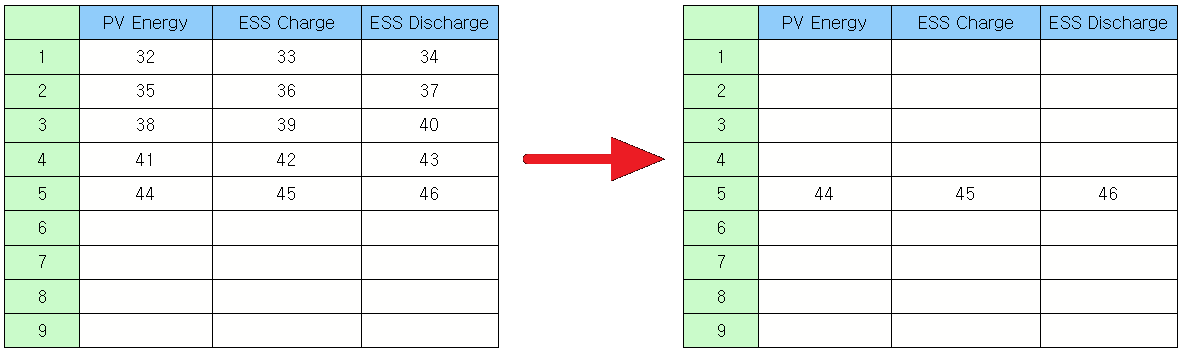
setGridData clears the data of the grid.
Example) setGridData removes all of the set data on the grid.
table =canvas.getObject('table') # Remove previously set data. table.clearGridData()
|
Results) |
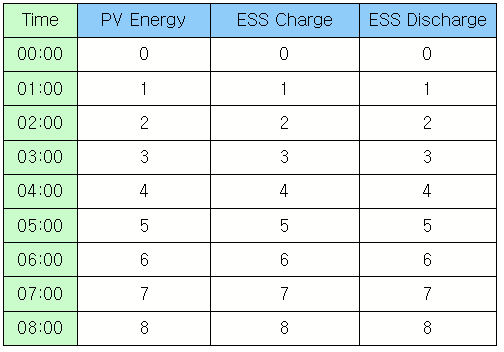
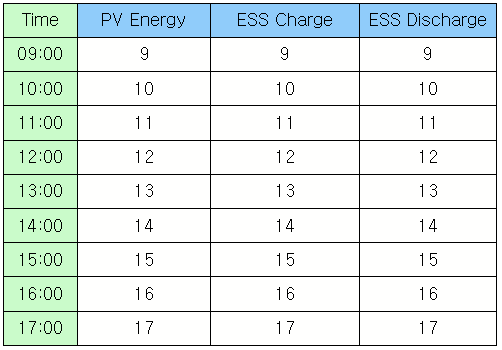
If the set data is more than rows, print the next data.
Example) moveNextPage prints the next data.
table =canvas.getObject('table') # Set the data on the grid. table.moveNextPage()
|
Results) |
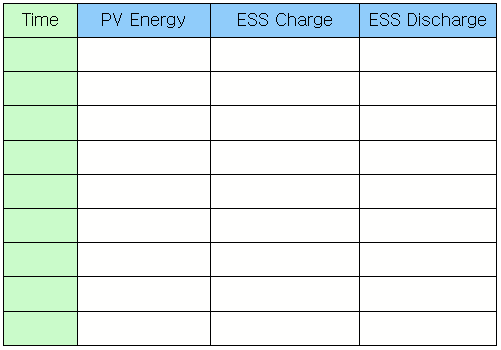
movePrevPage moves to the previous page.
Example)
table =canvas.getObject('table') # Set the data on the grid. table.movePrevPage()
|
Results) |
|
totalPage() |
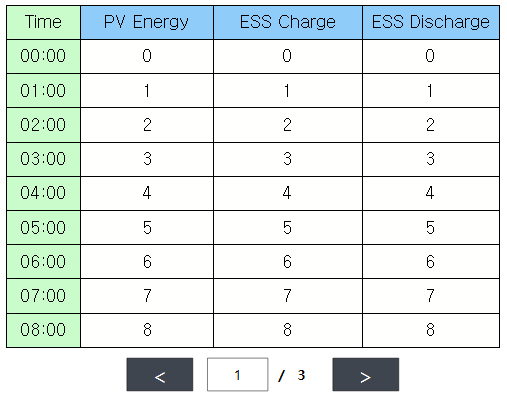
currentPage returns the current page, totalPage returns the total page number.
Example)
datas = list() for v in range(0,24): columnDatas = list() columnDatas.append('%.2d:00' % v) columnDatas.append(v) columnDatas.append(v) columnDatas.append(v) datas.append(columnDatas) table =canvas.getObject('table') table.setGridData(1,0,9,4,datas) o = canvas.getObject('totalPage') o.setProperty('FaceText',table.totalPage() ) o = canvas.getObject('currentPage') o.setProperty('FaceText',table.currentPage() )
|
Results) |
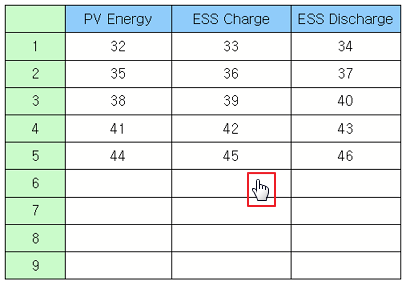
Set a unique value to the cell. It is used to differentiate data by cell category. ㆍ Unique value refers to the value used as a key. ㆍ For example, if you want to separate data in hourly. Set a unique value to '1am', '2am', '3am', '4am', '5am'. Example)
obj = canvas.getObject('Text Table') # Obtain the text table widget object. obj.setCellData(9, 0, 8) # Set a unique value as 8 to (9,0) of the text table widget.
|
|
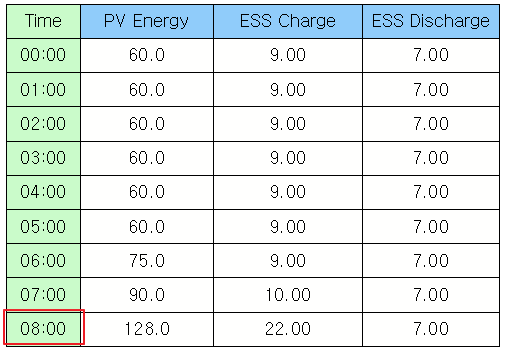
Read a unique value of cells. ㆍ Unique value refers the value used as a key. Example) Applied usage
import datetime obj = canvas.getObject('Text Table') # Obtain the text table widget object. hour_idx = obj.cellData(9, 0) # Read the unique value on (9,0) of the text table widget. st = datetime.datetime(2019, 1, 1, hour_idx, 0, 0) << 2019-1-1 0:00:00 of Python datetime format. et = st + datetime.timedelta(hours=1) << Add an hour to the current time. data_list = logAnalog.readAnalogLog(‘PV.Positive kWh’, st, et, logAnalog.Time) for v in range(0, len(data_list)): if data_list[v].isGood(): print data_list[v].deltaValue() # Obtain the variation of 'PV.Positive kWh'. data_list = logAnalog.readAnalogLog(‘PCS1.AC_AccumCharge’, st, et, logAnalog.Time) for v in range(0, len(data_list)): if data_list[v].isGood(): print data_list[v].deltaValue() # Obtain the variation of 'PCS1.AC_AccumCharge'. data_list = logAnalog.readAnalogLog(‘PCS1.AC_AccumDisCharge’, st, et, logAnalog.Time) for v in range(0, len(data_list)): if data_list[v].isGood(): print data_list[v].deltaValue() # Obtain the variation of 'PCS1.AC_AccumDisCharge'. |
Output)
38.0 12.0 0.0 |