Trend Widget*
Trend Widget
![]() Trend widget is a widget that is used to register points or trend groups to the widget and display the real time trend graph.
Trend widget is a widget that is used to register points or trend groups to the widget and display the real time trend graph.
User is able to do the following tasks through trend widget scripts.
- It is able to read the registered trend and display it as the real time trend.
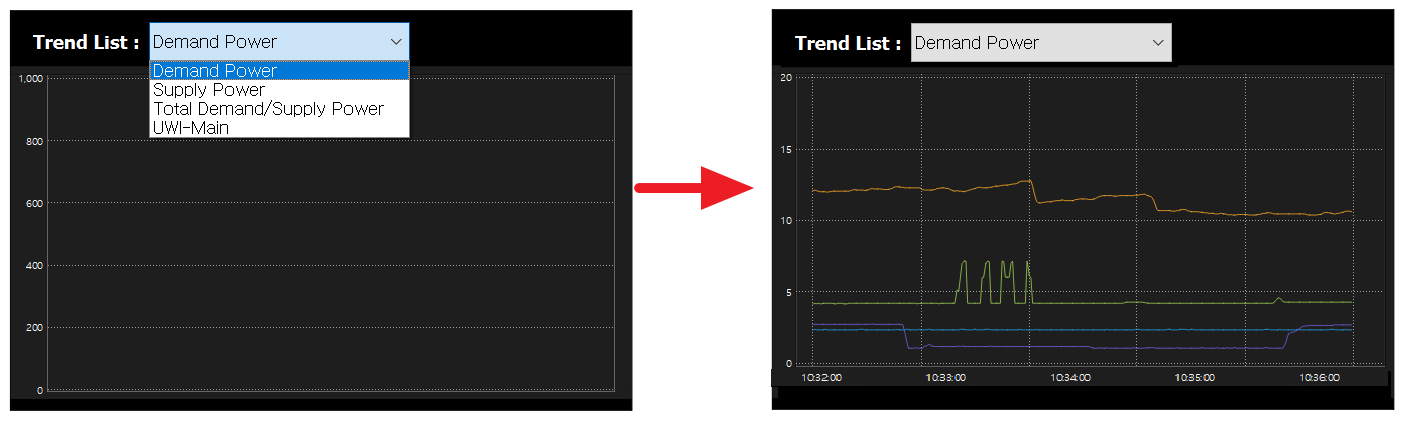
- It is able to search for the trend.
- It is able to read the value printed on the graph.
Methods
Trend widget provides the following functions.
Scripts for the Trend widget is the same as for the Data chart. Refer to the [Data Chart] function.
Return Type |
Method |
Description |
Add a bar graph data to the chart. |
||
Add a curve graph data to the chart. |
||
Add a line graph data to the chart. |
||
Enter the name of graphs to use the right Y-axis of the chart. |
||
Set the style of bar graphs to the chart. |
||
Set the line color of bar graphs to the chart. |
||
Set the space of bar graphs to the chart. |
||
setDataVisible( index, visible ) |
Reveal or hide the graph. |
|
Set the line color of line graphs to the chart. |
||
Set the line style of line graphs to the chart. |
||
Set the line width of line graphs to the chart. |
||
Set the range and space of the right Y-axis to the chart. |
||
Set the range and space of the Y-axis to the chart. |
Trend widget provides the following functions.
Return Type |
Method |
Description |
list[float] |
Read the data of graphs. |
|
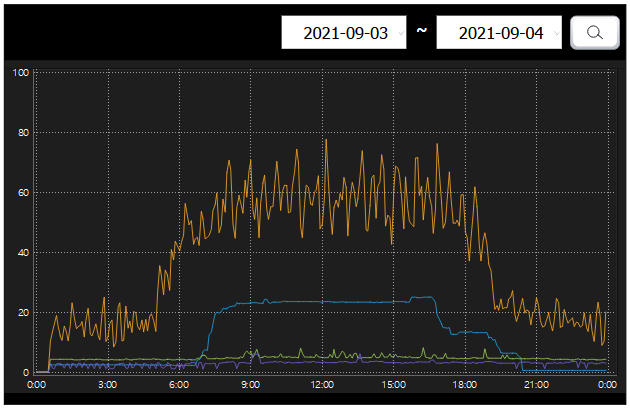
loadHistoryTrend( trendsetName, syear, smonth, sday, shour, sminute, |
Read the past trend and display it on the widget. |
|
Read the trend group and display it as the real time trend. |
Read the data printed on the graph. ㆍ name : Enter the name of graphs set on the history data chart widget.
Example)
chart = canvas.getObject('trend') # Obtain the trend widget. print chart.getGraphData('Outlet') |
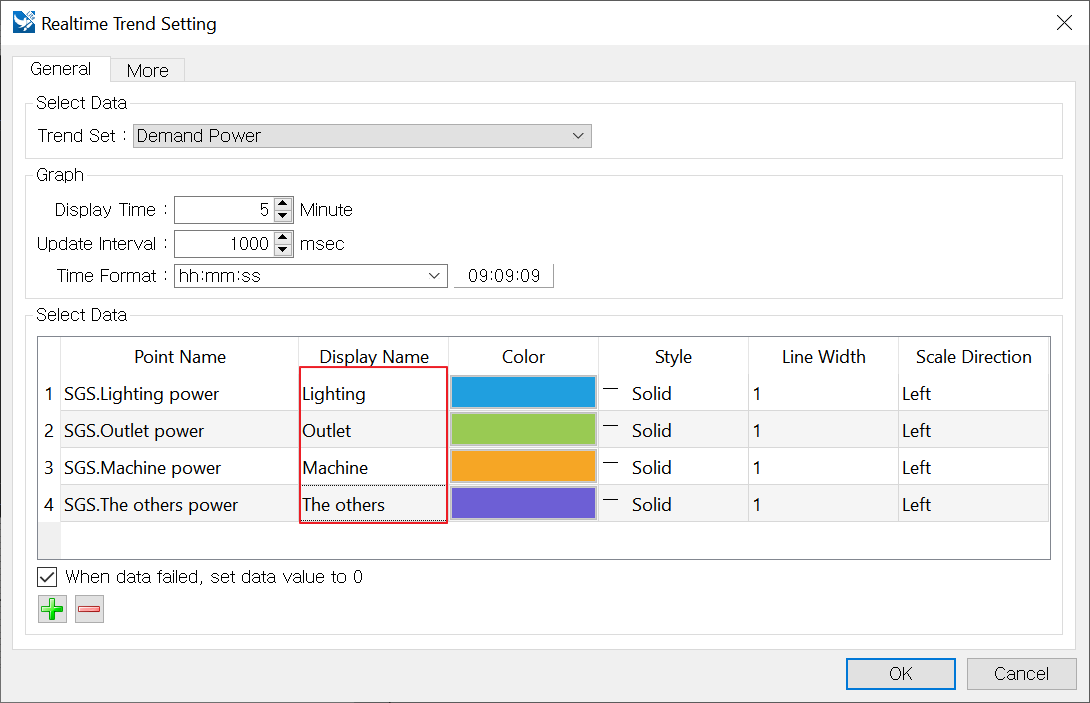
Read the data of the entered trend set and display it as the real time trend. ㆍ trendsetName setting is as follows. - When loading the entire data : 'Trend set name' - When loading a subset of data : {'Trend set name' : ['Point 1', 'Point 2'] } - When loading the data from two different trend set : ['Point 1', 'Point 2']
Example) When loading the entire data
chart = canvas.getObject('trend') # Obtain the trend widget. data = chart.loadTrendSet('Available Power') # Read 'Available Power' trend cell.
|
Example) When loading a subset of data
chart = canvas.getObject('trend') # Obtain the trend widget. name = {'Available Power' : ['Equipment1.Power', 'Equipment2.Power']} data = chart.loadTrendSet(name) # Read 'Equipment1.Power', 'Equipment2.Power' from 'Available Power'.
Example) When loading the data from two different trend set
chart = canvas.getObject('trend') # Obtain the trend widget name = ['Equipment1.Power', 'Equipment2.Power'] data = chart.loadTrendSet(name) # Read 'Equipment1.Power', 'Equipment2.Power'.
|