Grid Widget
Grid Widget
Grid Widget provides the function that reads the external data by using scripts and represents it as a form of a table.

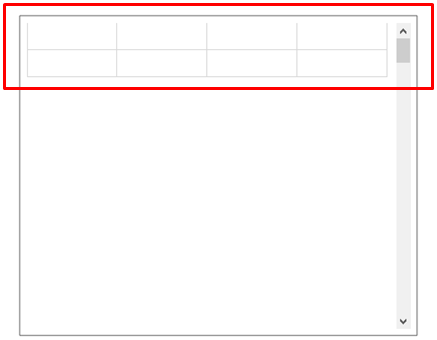
Grid widget is an object that represents the data as a form of a table, and it separates into the data area representing the header and data. It is constructed to cells.
If it is not able to represent the entire data on the screen, a scroll bar or horizontal scroll bar occurs.
The below shows the form of the grid widget.
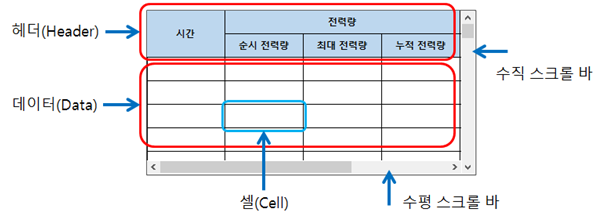
The detailed description of terms is as below.
Property |
Description |
The area represents the preface on the grid widget. |
|
It is the value or String displayed on the grid widget. |
|
The area represents each data. It is able to set and modify. |
|
Occur when it is not able to represent the whole data on the screen, and the user can check other data to move the scroll bar. |
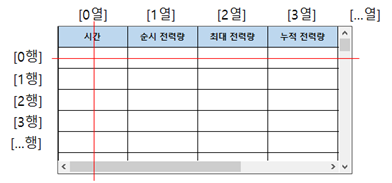
And the table consists of rows and columns. Rows increment by 1 from top to bottom the value 0 as the base. columns increment by 1 from left to right the value 0 as the base. It is able to check or set the data of cells by selecting rows and columns.
The below shows the form of rows and columns.
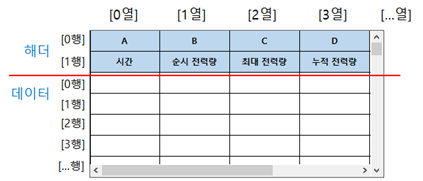
Also, the area of the header and data is managed by separating each row and column. The below shows the form of rows and columns of the header and data area.
Methods
To use the grid widget object, obtain the grid widget on the canvas by using the canvas object. Using grid widget objects, it is able to set a value on rows and columns or write the shape of tables.
Return Type |
Method |
Description |
variant |
cellData( row, column ) |
Read the data saved on the cell. |
checkBoxChecked( int, int, bool ) |
It is a check event handler generating events depending on the check state of the check box. |
|
clearAll() |
Remove all data of the grid widget including the header. |
|
Remove all data of the grid widget. |
||
Remove all data of the header of the grid widget. |
||
Cancel the selection on cells. |
||
int |
Obtain the number of columns. |
|
connect( eventName, func ) |
Register an event handler to the grid widget. |
|
int |
Obtain the currently selected row on the grid widget. |
|
int |
Obtain the currently selected column on the grid widget. |
|
str |
dataText( row, column ) |
Obtain the String of the cell by selecting the entered row and column on the grid widget. |
int |
Obtain the default String alignment. |
|
Fit the size of all rows and columns on the size of data in the grid widget. |
||
Fit the size of all rows and columns on the size of data in the grid widget header. |
||
str |
Obtain the line color of the grid widget. |
|
str |
headerText( row, column ) |
Obtain the String of cells by selecting the entered row and column on the grid widget header. |
isChecked( row, column ) |
Read the check state of check boxes by selecting the row and column of the grid widget. |
|
Set the header of the grid widget to the previous value. |
||
int |
rowCount() |
Obtain the number of columns of the grid widget. |
top, left, bottom, right |
Read the range of the currently selected cells. |
|
setAllHeaderBold( enable ) |
Set the width of all Strings of the grid widget header. |
|
setAllHeaderTextSize( size ) |
Set the size of all Strings of the grid widget header. |
|
setCellData( row, column, data ) |
Save the data to cells. |
|
setCheckBox( row, column ) |
Add a check box by selecting the row and column of the grid widget. |
|
setChecked( row, column, checked ) |
Set the check of check boxes by selecting the row and column of the grid widget. |
|
setColumnWidth( column, width ) |
Set the width of columns. |
|
setCurrentIndex( row ) |
Set the selected column of the grid widget. |
|
setDataBackgroundColor( row, column, color ) |
Set the background color of cells by selecting the row and column of the grid widget. |
|
setDataCellHeight( size ) |
Set the height of cells of the grid widget. |
|
setDataCount( row, column ) |
Set the number of rows and columns of the grid widget. |
|
setDataSpan( row, column, rowCount, columnCount ) |
Merge cells by saving rows and columns of the grid widget. |
|
setDataText( row, column, text ) |
Set the String of cells by selecting the row and column of the grid widget. |
|
setDataTextAlignment( row, column, flag ) |
Set the String alignment of cells by selecting the row and column of the grid widget. |
|
setDataTextBold( row, column, enable ) |
Set the String width of cells by selecting the row and column of the grid widget. |
|
setDataTextColor( row, column, color ) |
Set the String color of cells by selecting the row and column of the grid widget. |
|
setDataTextSize( row, column, size ) |
Set the String size of cells by selecting the row and column of the grid widget. |
|
setDefaultTextAlignment( flag ) |
Set the default String alignment of the grid widget. |
|
setEditable( editable ) |
Set whether the entire data cell is editable. |
|
setEditable( row, column, editable ) |
Set whether the cell is editable by selecting the row and columns of the grid widget. |
|
setEnabled( enable ) |
Set enable or disable the grid widget. |
|
setFrozenColumn( col ) |
Set the fixed column by selecting the row of the grid widget. |
|
setGridColor( color ) |
Set the line color of the grid widget. |
|
setHeaderBackgroundColor( color ) |
Set the background color of headers of the grid widget. |
|
setHeaderBackgroundColor( row, column, color ) |
Set the background color of cells by selecting the row and column of the grid widget header. |
|
setHeaderBold( enable ) |
Set the text width of headers of the grid widget. |
|
setHeaderCellHeight( size ) |
Set the cell height of headers of the grid widget. |
|
setHeaderCount( row, column ) |
Set the number of rows and columns of the grid widget header. |
|
setHeaderSpan( row, column, rowCount, columnCount ) |
Merge cells by selecting rows and columns of the grid widget header. |
|
setHeaderText( row, column, text ) |
Set the String of cells by selecting the row and column of the grid widget header. |
|
setHeaderTextAlignment( row, column, flag ) |
Set the String alignment of cells by selecting the row and column of the grid widget header. |
|
setHeaderTextBold( row, column, enable ) |
Set the String width of cells by selecting the row and column of the grid widget header. |
|
setHeaderTextColor( color ) |
Change the text color of headers of the grid widget. |
|
setHeaderTextColor( row, column, color ) |
Set the String color of cells by selecting the row and column of the grid widget header. |
|
setHeaderTextSize( row, column, size ) |
Set the String size of cells by selecting the row and column of the grid widget header. |
|
setHeaderTextSize( size ) |
Change the text size of headers of the grid widget. |
|
setPushButton( row, column ) |
Insert a press button to the cell. |
|
setSelectionMode( mode ) |
Set the data selection of the grid widget. |
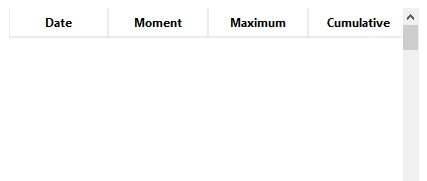
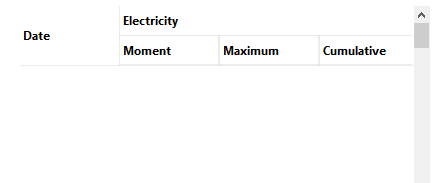
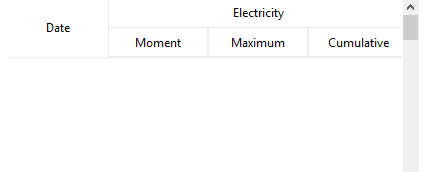
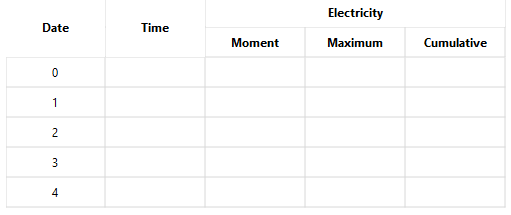
setHeaderText sets the String to the grid widget header. Set the String to the row and column the user entered. ㆍ row: Enter the row to set the String. ㆍ column: Enter the column to set the String. ㆍ text: Enter the String to set. Example) grid = canvas.getObject('GridWidget') # Obtain the grid widget. grid.setHeaderCount(1, 4) # Set data of the grid widget header to (1,4). grid.setHeaderText(0, 0, 'Date') # Set the text of (0,0) to 'Date'. grid.setHeaderText(0, 1, 'Moment') # Set the text of (0,1) to 'Moment'. grid.setHeaderText(0, 2, 'Maximum') # Set the text of (0,2) to 'Maximum'. grid.setHeaderText(0, 3, 'Cumulative') # Set the text of (0,3) to 'Cumulative'. |
|
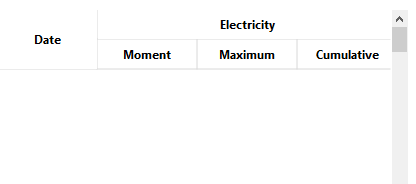

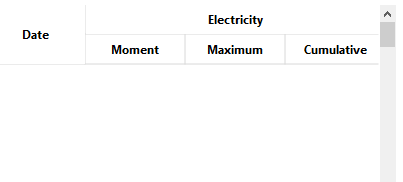
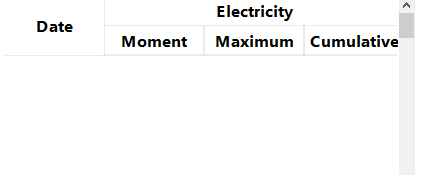
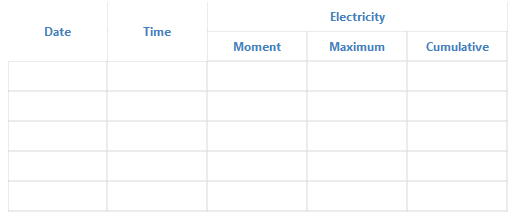
setAllHeaderBold sets the String width of all grid widget header. ㆍ enable: If entering 1, it sets the String width as thick. ㆍ enable: If entering 0, it sets the String width as normal. Example) grid = canvas.getObject('GridWidget') # Obtain the grid widget. grid.setHeaderCount(2, 4) # Set data of grid widget header to (2,4). # Merge (0,0) and (1,0) of the grid widget header. grid.setHeaderSpan(0, 0, 2, 1); # Merge (0,1), (0,2), (0,3) of the grid widget header. grid.setHeaderSpan(0, 1, 1, 3); grid.setHeaderText(0, 0, 'Date') # Set the text of (0,0) to 'Date'. grid.setHeaderText(0, 1, 'Electricity') # Set the text of (0,1) to 'Electricity'. grid.setHeaderText(0, 1, 'Moment') # Set the text of (0,1) to 'Moment'. grid.setHeaderText(0, 2, 'Maximum') # Set the text of (0,2) to 'Maximum'. grid.setHeaderText(0, 3, 'Cumulative') # Set the text of (0,3) to 'Cumulative'. # Set the text as thick. grid.setAllHeaderBold(1); # Release the thick. grid.setAllHeaderBold(0); |
This is the screen of the text width setting of the entire header. |
|
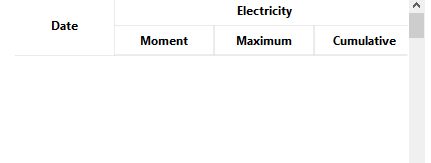
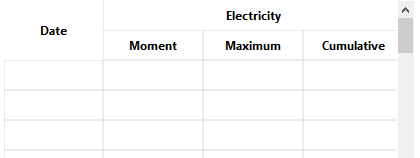
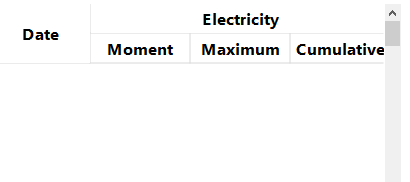
This is the screen of the text width release of the entire header. |
|
setAllHeaderTextSize sets the String size of the grid widget header. ㆍ size: Enter the text size of the grid widget header. Example) grid = canvas.getObject('GridWidget') # Obtain the grid widget. grid.setHeaderCount(2, 4) # Set data of grid widget header to (2,4). # Merge (0,0) and (1,0) of the grid widget header. grid.setHeaderSpan(0, 0, 2, 1); # Merge (0,1), (0,2), (0,3) of the grid widget header. grid.setHeaderSpan(0, 1, 1, 3); grid.setHeaderText(0, 0, 'Date') # Set the text of (0,0) to 'Date'. grid.setHeaderText(0, 1, 'Electricity') # Set the text of (0,1) to 'Electricity'. grid.setHeaderText(0, 1, 'Moment') # Set the text of (0,1) to 'Moment'. grid.setHeaderText(0, 2, 'Maximum') # Set the text of (0,2) to 'Maximum'. grid.setHeaderText(0, 3, 'Cumulative') # Set the text of (0,3) to 'Cumulative'.
# Set the size of text as 12. grid.setAllHeaderTextSize(12) |
|
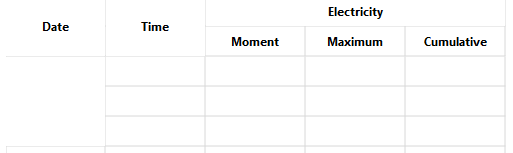
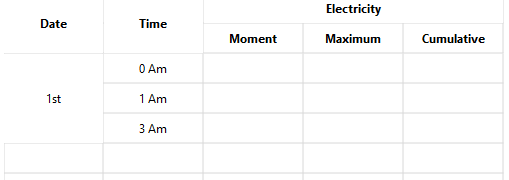
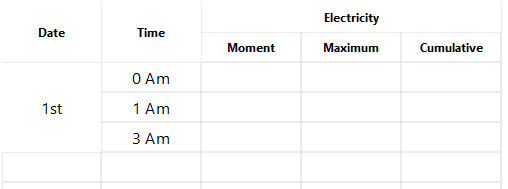
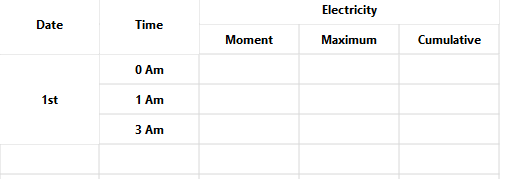
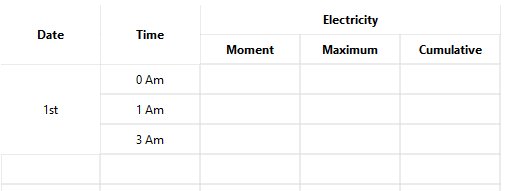
setDataSpan sets the String to rows on columns of the grid widget. ㆍ row: Enter the row to set the String. ㆍ column: Enter the column to set the String. ㆍ text: Enter the String to set. Example) grid = canvas.getObject('GridWidget') # Obtain the grid widget. grid.setHeaderCount(2, 5) # Set data of the grid widget header to (2,5). # Merge (0,0), (1,0) of the grid widget header. grid.setHeaderSpan(0, 0, 2, 1); # Merge (0,1), (1,1) of the grid widget header. grid.setHeaderSpan(0, 1, 2, 1); # Merge (0,2), (0,3), (0,4) of the grid widget header. grid.setHeaderSpan(0, 2, 1, 3); grid.setHeaderText(0, 0, 'Date') # Set the text of (0,0) as 'Date'. grid.setHeaderText(0, 1, 'Time') # Set the text of (0,1) as 'Time'. grid.setHeaderText(0, 2, 'Electricity') # Set the text of (0,2) as 'Electricity'. grid.setHeaderText(1, 2, 'Moment') # Set the text of (1,2) as 'Moment'. grid.setHeaderText(1, 3, 'Maximum') # Set the text of (1,3) as 'Maximum'. grid.setHeaderText(1, 4, 'Cumulative') # Set the text of (1,4) as 'Cumulative'. # Set data of the grid widget to (5,5). grid.setDataCount(5, 5)
# Merge (0,0), (1,0), (2,0) of the grid widget. grid.setDataSpan(0, 0, 3, 1); grid.setDataText(0, 0, '1st') # Set the text of (0,0) as '1st'. grid.setDataText(1, 0, '2nd') # Set the text of (1,0) as '2nd'. grid.setDataText(2, 0, '3rd') # Set the text of (2,0) as '3rd'. grid.setDataText(0, 1, '0 am') # Set the text of (0,1) as '0 am'. grid.setDataText(1, 1, '1 am') # Set the text of (1,1) as '1 am'. grid.setDataText(2, 1, '3 am') # Set the text of (2,1) as '2 am'. |
|
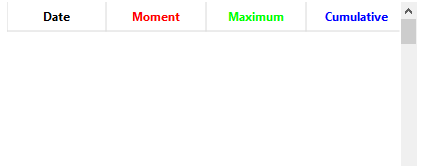
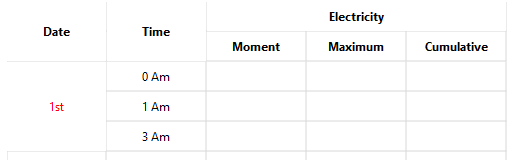
setDataTextColor sets the String color to the row and column of the grid widget. ㆍ row: Enter the row to set the String. ㆍ column: Enter the column to set the String. ㆍ color: Enter the String color using the QColor object. QColor has to be set RGB color values and transparency values. Each value is an Integer number between 0 to 255. QColor object is used as follows. ㆍ Function QColor(red,green,blue,transparency) ㆍ Use example - Red: QColor(255,0,0,255) - Green: QColor(0,255,0,128) - Blue: QColor(0,0,255,255) Example) grid = canvas.getObject('GridWidget') # Obtain the grid widget. grid.setHeaderCount(2, 5) # Set data of the grid widget header to (2,5). # Merge (0,0), (1,0) of the grid widget header. grid.setHeaderSpan(0, 0, 2, 1); # Merge (0,1), (1,1) of the grid widget header. grid.setHeaderSpan(0, 1, 2, 1); # Merge (0,2), (0,3), (0,4) of the grid widget header. grid.setHeaderSpan(0, 2, 1, 3); grid.setHeaderText(0, 0, 'Date') # Set the text of (0,0) as 'Date'. grid.setHeaderText(0, 1, 'Date') # Set the text of (0,1) as 'Date'. grid.setHeaderText(0, 2, 'Electricity') # Set the text of (0,2) as 'Electricity'. grid.setHeaderText(1, 2, 'Moment') # Set the text of (1,2) as 'Moment'. grid.setHeaderText(1, 3, 'Maximum') # Set the text of (1,3) as 'Maximum'. grid.setHeaderText(1, 4, 'Cumulative') # Set the text of (1,4) as 'Cumulative'. # Set data of the grid widget to (5,5). grid.setDataCount(5, 5)
# Merge (0,0), (1,0), (2,0) of the grid widget. grid.setDataSpan(0, 0, 3, 1); grid.setDataText(0, 0, '1st') # Set the text of (0,0) as '1st'. grid.setDataText(1, 0, '2nd') # Set the text of (1,0) as '2nd'. grid.setDataText(2, 0, '3rd') # Set the text of (2,0) as '3rd'. grid.setDataText(0, 1, '0 am') # Set the text of (0,1) as '0 am'. grid.setDataText(1, 1, '1 am') # Set the text of (1,1) as '1 am'. grid.setDataText(2, 1, '3 am') # Set the text of (2,1) as '3 am'. # Set the text color of (0,0) as QColor('#FF0000'). grid.setDataTextColor(0, 0, QColor('#FF0000')) |
|
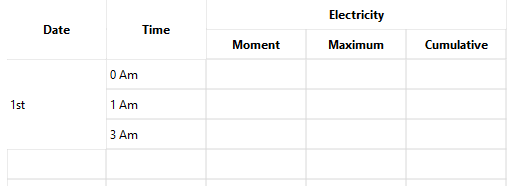
setDataTextBold sets the String width to rows and columns of the grid widget. ㆍ row: Enter rows of the grid widget. ㆍ column: Enter columns of the grid widget. ㆍ enable: Enter 0 or 1. - If entering 1, the String is getting thicker. - If entering 0, the String is not getting thicker. Example) grid = canvas.getObject('GridWidget') # Obtain the grid widget. grid.setHeaderCount(2, 5) # Set data of the grid widget header to (2,5). # Merge (0,0), (1,0) of the grid widget header. grid.setHeaderSpan(0, 0, 2, 1); # Merge (0,1), (1,1) of the grid widget header. grid.setHeaderSpan(0, 1, 2, 1); # Merge (0,2), (0,3), (0,4) of the grid widget header. grid.setHeaderSpan(0, 2, 1, 3); grid.setHeaderText(0, 0, 'Date') # Set the text of (0,0) as 'Date'. grid.setHeaderText(0, 1, 'Date') # Set the text of (0,1) as 'Date'. grid.setHeaderText(0, 2, 'Electricity') # Set the text of (0,2) as 'Electricity'. grid.setHeaderText(1, 2, 'Moment') # Set the text of (1,2) as 'Moment'. grid.setHeaderText(1, 3, 'Maximum') # Set the text of (1,3) as 'Maximum'. grid.setHeaderText(1, 4, 'Cumulative') # Set the text of (1,4) as 'Cumulative'. # Set data of the grid widget to (5,5). grid.setDataCount(5, 5)
# Merge (0,0), (1,0), (2,0) of the grid widget. grid.setDataSpan(0, 0, 3, 1); grid.setDataText(0, 0, '1st') # Set the text of (0,0) as '1st'. grid.setDataText(1, 0, '2nd') # Set the text of (1,0) as '2nd'. grid.setDataText(2, 0, '3rd') # Set the text of (2,0) as '3rd'. grid.setDataText(0, 1, '0 am') # Set the text of (0,1) as '0 am'. grid.setDataText(1, 1, '1 am') # Set the text of (1,1) as '1 am'. grid.setDataText(2, 1, '3 am') # Set the text of (2,1) as '3 am'. # Set the text of the grid widget as thick. for r in range(0,5): for c in range(0,2): grid.setDataTextBold(r,c,1); # Release the thick. for r in range(0,5): for c in range(0,2): grid.setDataTextBold(r,c,0); |
This is the set of String width. |
|
This is the release of String width. |
|

setEditable sets whether rows and columns of the grid widget is editable. ㆍ row: Enter rows of the grid widget. ㆍ column: Enter columns of the grid widget. ㆍ enable: Enter 0 or 1. - If entering 1, set cells of the grid widget editable. - If entering 0, set cells of the gird widget uneditable. Example) grid = canvas.getObject('GridWidget') # Obtain the grid widget. grid.setHeaderCount(2, 5) # Set data of the grid widget header to (2,5). # Merge (0,0), (1,0) of the grid widget header. grid.setHeaderSpan(0, 0, 2, 1); # Merge (0,1), (1,1) of the grid widget header. grid.setHeaderSpan(0, 1, 2, 1); # Merge (0,2), (0,3), (0,4) of the grid widget header. grid.setHeaderSpan(0, 2, 1, 3); grid.setHeaderText(0, 0, 'Date') # Set the text of (0,0) as 'Date'. grid.setHeaderText(0, 1, 'Date') # Set the text of (0,1) as 'Date'. grid.setHeaderText(0, 2, 'Electricity') # Set the text of (0,2) as 'Electricity'. grid.setHeaderText(1, 2, 'Moment') # Set the text of (1,2) as 'Moment'. grid.setHeaderText(1, 3, 'Maximum') # Set the text of (1,3) as 'Maximum'. grid.setHeaderText(1, 4, 'Cumulative') # Set the text of (1,4) as 'Cumulative'. # Set data of the grid widget to (5,5). grid.setDataCount(5, 5)
# Merge (0,0), (1,0), (2,0) of the grid widget. grid.setDataSpan(0, 0, 3, 1); grid.setDataText(0, 0, '1st') # Set the text of (0,0) as '1st'. grid.setDataText(1, 0, '2nd') # Set the text of (1,0) as '2nd'. grid.setDataText(2, 0, '3rd') # Set the text of (2,0) as '3rd'. grid.setDataText(0, 1, '0 am') # Set the text of (0,1) as '0 am'. grid.setDataText(1, 1, '1 am') # Set the text of (1,1) as '1 am'. grid.setDataText(2, 1, '3 am') # Set the text of (2,1) as '3 am'.
# Set cells between (0,0) to (5,2) ineditable. for r in range(0,5): for c in range(0,2): grid.setEditable(r,c,0) |
|
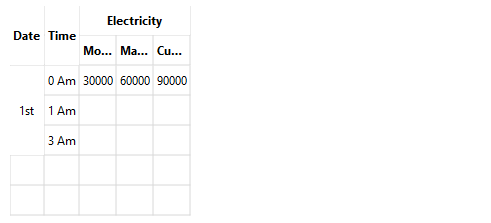
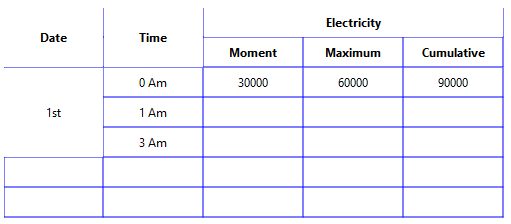
fitByData fits the size of all rows and columns on the size of data. Example) grid = canvas.getObject('GridWidget') # Obtain the grid widget. grid.setHeaderCount(2, 5) # Set data of the grid widget header to (2,5). # Merge (0,0), (1,0) of the grid widget header. grid.setHeaderSpan(0, 0, 2, 1); # Merge (0,1), (1,1) of the grid widget header. grid.setHeaderSpan(0, 1, 2, 1); # Merge (0,2), (0,3), (0,4) of the grid widget header. grid.setHeaderSpan(0, 2, 1, 3); grid.setHeaderText(0, 0, 'Date') # Set the text of (0,0) as 'Date'. grid.setHeaderText(0, 1, 'Date') # Set the text of (0,1) as 'Date'. grid.setHeaderText(0, 2, 'Electricity') # Set the text of (0,2) as 'Electricity'. grid.setHeaderText(1, 2, 'Moment') # Set the text of (1,2) as 'Moment'. grid.setHeaderText(1, 3, 'Maximum') # Set the text of (1,3) as 'Maximum'. grid.setHeaderText(1, 4, 'Cumulative') # Set the text of (1,4) as 'Cumulative'. # Set data of the grid widget to (5,5). grid.setDataCount(5, 5)
# Merge (0,0), (1,0), (2,0) of the grid widget. grid.setDataSpan(0, 0, 3, 1); grid.setDataText(0, 0, '1st') # Set the text of (0,0) as '1st'. grid.setDataText(1, 0, '2nd') # Set the text of (1,0) as '2nd'. grid.setDataText(2, 0, '3rd') # Set the text of (2,0) as '3rd'. grid.setDataText(0, 1, '0 am') # Set the text of (0,1) as '0 am'. grid.setDataText(1, 1, '1 am') # Set the text of (1,1) as '1 am'. grid.setDataText(2, 1, '3 am') # Set the text of (2,1) as '3 am'. grid.setDataText(0, 2, '30000') # Set the text of (0,2) as '30000'. grid.setDataText(0, 3, '60000') # Set the text of (0,3) as '60000'. grid.setDataText(0, 4, '90000') # Set the text of (0,4) as '90000'. # Fit the size of all rows and columns on the size of data. data. grid.fitByData() |
|
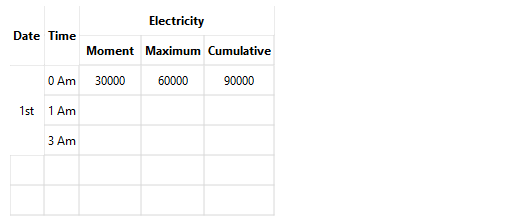
ffitByHeader fits the size of all rows and columns on the size of the header data. Example) grid = canvas.getObject('GridWidget') # Obtain the grid widget. grid.setHeaderCount(2, 5) # Set data of the grid widget header to (2,5). # Merge (0,0), (1,0) of the grid widget header. grid.setHeaderSpan(0, 0, 2, 1); # Merge (0,1), (1,1) of the grid widget header. grid.setHeaderSpan(0, 1, 2, 1); # Merge (0,2), (0,3), (0,4) of the grid widget header. grid.setHeaderSpan(0, 2, 1, 3); grid.setHeaderText(0, 0, 'Date') # Set the text of (0,0) as 'Date'. grid.setHeaderText(0, 1, 'Date') # Set the text of (0,1) as 'Date'. grid.setHeaderText(0, 2, 'Electricity') # Set the text of (0,2) as 'Electricity'. grid.setHeaderText(1, 2, 'Moment') # Set the text of (1,2) as 'Moment'. grid.setHeaderText(1, 3, 'Maximum') # Set the text of (1,3) as 'Maximum'. grid.setHeaderText(1, 4, 'Cumulative') # Set the text of (1,4) as 'Cumulative'. # Set data of the grid widget to (5,5). grid.setDataCount(5, 5)
# Merge (0,0), (1,0), (2,0) of the grid widget. grid.setDataSpan(0, 0, 3, 1); grid.setDataText(0, 0, '1st') # Set the text of (0,0) as '1st'. grid.setDataText(1, 0, '2nd') # Set the text of (1,0) as '2nd'. grid.setDataText(2, 0, '3rd') # Set the text of (2,0) as '3rd'. grid.setDataText(0, 1, '0 am') # Set the text of (0,1) as '0 am'. grid.setDataText(1, 1, '1 am') # Set the text of (1,1) as '1 am'. grid.setDataText(2, 1, '3 am') # Set the text of (2,1) as '3 am'. grid.setDataText(0, 2, '30000') # Set the text of (0,2) as '30000'. grid.setDataText(0, 3, '60000') # Set the text of (0,3) as '60000'. grid.setDataText(0, 4, '90000') # Set the text of (0,4) as '90000'. # Fit the size of all rows and columns on the size of the header data. grid.fitByHeader() |
|
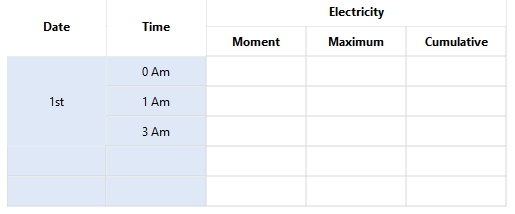
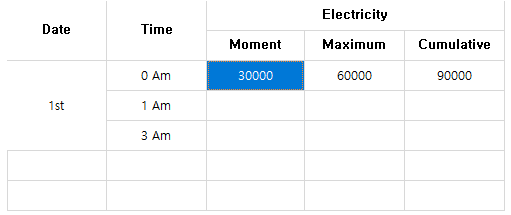
setSelectionMode sets the data selection of the grid widget. ㆍ mode: Enter the cell selection of the grid widget. - GridWidgetItem.NoSelection: Set no selection to the cell. - GridWidgetItem.Single: Set a single selection to the cell. - GridWidgetItem.Multi: Set a multi selection to the cell Example) grid = canvas.getObject('GridWidget') # Obtain the grid widget. grid.setHeaderCount(2, 5) # Set data of the grid widget header to (2,5). # Merge (0,0), (1,0) of the grid widget header. grid.setHeaderSpan(0, 0, 2, 1); # Merge (0,1), (1,1) of the grid widget header. grid.setHeaderSpan(0, 1, 2, 1); # Merge (0,2), (0,3), (0,4) of the grid widget header. grid.setHeaderSpan(0, 2, 1, 3); grid.setHeaderText(0, 0, 'Date') # Set the text of (0,0) as 'Date'. grid.setHeaderText(0, 1, 'Date') # Set the text of (0,1) as 'Date'. grid.setHeaderText(0, 2, 'Electricity') # Set the text of (0,2) as 'Electricity'. grid.setHeaderText(1, 2, 'Moment') # Set the text of (1,2) as 'Moment'. grid.setHeaderText(1, 3, 'Maximum') # Set the text of (1,3) as 'Maximum'. grid.setHeaderText(1, 4, 'Cumulative') # Set the text of (1,4) as 'Cumulative'. # Set data of the grid widget to (5,5). grid.setDataCount(5, 5)
# Merge (0,0), (1,0), (2,0) of the grid widget. grid.setDataSpan(0, 0, 3, 1); grid.setDataText(0, 0, '1st') # Set the text of (0,0) as '1st'. grid.setDataText(1, 0, '2nd') # Set the text of (1,0) as '2nd'. grid.setDataText(2, 0, '3rd') # Set the text of (2,0) as '3rd'. grid.setDataText(0, 1, '0 am') # Set the text of (0,1) as '0 am'. grid.setDataText(1, 1, '1 am') # Set the text of (1,1) as '1 am'. grid.setDataText(2, 1, '3 am') # Set the text of (2,1) as '3 am'. grid.setDataText(0, 2, '30000') # Set the text of (0,2) as '30000'. grid.setDataText(0, 3, '60000') # Set the text of (0,3) as '60000'. grid.setDataText(0, 4, '90000') # Set the text of (0,4) as '90000'. #Set a single selection to the cell. grid.setSelectionMode(GridWidgetItem.Single) #Set a multi selection to the cell. grid.setSelectionMode(GridWidgetItem.Multi) |
This is the setting of a single selection. |
|
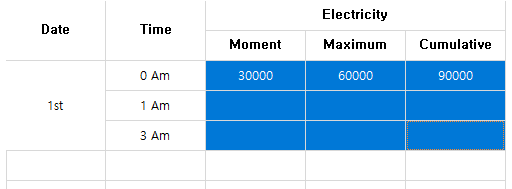
This is the setting of a multi selection. |
|
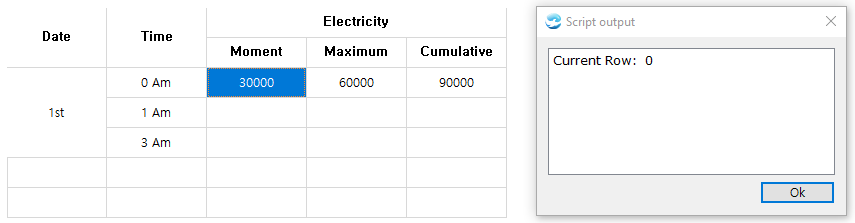
currentRow obtains the currently selected row on the grid widget. Return the number of the currently selected row on the grid widget. Example) grid = canvas.getObject('GridWidget') # Obtain the grid widget. value = grid.currentRow() # Return the number of the currently selected row on the grid widget. print "Current Row : ", value
|
|
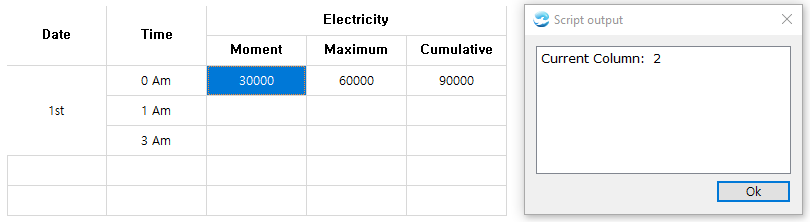
currentColumn obtains the currently selected column on the grid widget. Return the number of the currently selected column on the grid widget. Example) grid = canvas.getObject(GridWidget') # Obtain the grid widget. value = grid.currentColumn() # Return the number of the currently selected column on the grid widget. print “Current Column : “, value |
|
rowCount obtains the number of rows of the grid widget. Return the number of rows as an Integer value. Example) grid = canvas.getObject('GridWidget') # Obtain the grid widget. grid.setHeaderCount(2, 5) # Set data of the grid widget header to (2,5). # Merge (0,0), (1,0) of the grid widget header. grid.setHeaderSpan(0, 0, 2, 1); # Merge (0,1), (1,1) of the grid widget header. grid.setHeaderSpan(0, 1, 2, 1); # Merge (0,2), (0,3), (0,4) of the grid widget header. grid.setHeaderSpan(0, 2, 1, 3); grid.setHeaderText(0, 0, 'Date') # Set the text of (0,0) as 'Date'. grid.setHeaderText(0, 1, 'Date') # Set the text of (0,1) as 'Date'. grid.setHeaderText(0, 2, 'Electricity') # Set the text of (0,2) as 'Electricity'. grid.setHeaderText(1, 2, 'Moment') # Set the text of (1,2) as 'Moment'. grid.setHeaderText(1, 3, 'Maximum') # Set the text of (1,3) as 'Maximum'. grid.setHeaderText(1, 4, 'Cumulative') # Set the text of (1,4) as 'Cumulative'. # Set data of the grid widget to (5,5). grid.setDataCount(5, 5)
# Merge (0,0), (1,0), (2,0) of the grid widget. grid.setDataSpan(0, 0, 3, 1); grid.setDataText(0, 0, '1st') # Set the text of (0,0) as '1st'. grid.setDataText(1, 0, '2nd') # Set the text of (1,0) as '2nd'. grid.setDataText(2, 0, '3rd') # Set the text of (2,0) as '3rd'. grid.setDataText(0, 1, '0 am') # Set the text of (0,1) as '0 am'. grid.setDataText(1, 1, '1 am') # Set the text of (1,1) as '1 am'. grid.setDataText(2, 1, '3 am') # Set the text of (2,1) as '3 am'. grid.setDataText(0, 2, '30000') # Set the text of (0,2) as '30000'. grid.setDataText(0, 3, '60000') # Set the text of (0,3) as '60000'. grid.setDataText(0, 4, '90000') # Set the text of (0,4) as '90000'. # Obtain the number of rows of the grid widget. rows = grid.rowCount() print 'Row count : ', rows |
This is a result. |
>> Row count : 5
|
columnCount obtains the number of columns of the grid widget. Return the number of columns as an Integer value. Example) grid = canvas.getObject('GridWidget') # Obtain the grid widget. grid.setHeaderCount(2, 5) # Set data of the grid widget header to (2,5). # Merge (0,0), (1,0) of the grid widget header. grid.setHeaderSpan(0, 0, 2, 1); # Merge (0,1), (1,1) of the grid widget header. grid.setHeaderSpan(0, 1, 2, 1); # Merge (0,2), (0,3), (0,4) of the grid widget header. grid.setHeaderSpan(0, 2, 1, 3); grid.setHeaderText(0, 0, 'Date') # Set the text of (0,0) as 'Date'. grid.setHeaderText(0, 1, 'Date') # Set the text of (0,1) as 'Date'. grid.setHeaderText(0, 2, 'Electricity') # Set the text of (0,2) as 'Electricity'. grid.setHeaderText(1, 2, 'Moment') # Set the text of (1,2) as 'Moment'. grid.setHeaderText(1, 3, 'Maximum') # Set the text of (1,3) as 'Maximum'. grid.setHeaderText(1, 4, 'Cumulative') # Set the text of (1,4) as 'Cumulative'. # Set data of the grid widget to (5,5). grid.setDataCount(5, 5)
# Merge (0,0), (1,0), (2,0) of the grid widget. grid.setDataSpan(0, 0, 3, 1); grid.setDataText(0, 0, '1st') # Set the text of (0,0) as '1st'. grid.setDataText(1, 0, '2nd') # Set the text of (1,0) as '2nd'. grid.setDataText(2, 0, '3rd') # Set the text of (2,0) as '3rd'. grid.setDataText(0, 1, '0 am') # Set the text of (0,1) as '0 am'. grid.setDataText(1, 1, '1 am') # Set the text of (1,1) as '1 am'. grid.setDataText(2, 1, '3 am') # Set the text of (2,1) as '3 am'. grid.setDataText(0, 2, '30000') # Set the text of (0,2) as '30000'. grid.setDataText(0, 3, '60000') # Set the text of (0,3) as '60000'. grid.setDataText(0, 4, '90000') # Set the text of (0,4) as '90000'. # Obtain the number of columns of the grid widget. column = grid.columnCount() print 'Column count : ', column
|
This is a result. |
>> Column count : 5
|
dataText obtains the String of rows and columns of the grid widget. Return the String of rows and columns of the grid widget. Example) grid = canvas.getObject('GridWidget') # Obtain the grid widget. grid.setHeaderCount(2, 5) # Set data of the grid widget header to (2,5). # Merge (0,0), (1,0) of the grid widget header. grid.setHeaderSpan(0, 0, 2, 1); # Merge (0,1), (1,1) of the grid widget header. grid.setHeaderSpan(0, 1, 2, 1); # Merge (0,2), (0,3), (0,4) of the grid widget header. grid.setHeaderSpan(0, 2, 1, 3); grid.setHeaderText(0, 0, 'Date') # Set the text of (0,0) as 'Date'. grid.setHeaderText(0, 1, 'Date') # Set the text of (0,1) as 'Date'. grid.setHeaderText(0, 2, 'Electricity') # Set the text of (0,2) as 'Electricity'. grid.setHeaderText(1, 2, 'Moment') # Set the text of (1,2) as 'Moment'. grid.setHeaderText(1, 3, 'Maximum') # Set the text of (1,3) as 'Maximum'. grid.setHeaderText(1, 4, 'Cumulative') # Set the text of (1,4) as 'Cumulative'. # Set data of the grid widget to (5,5). grid.setDataCount(5, 5)
# Merge (0,0), (1,0), (2,0) of the grid widget. grid.setDataSpan(0, 0, 3, 1); grid.setDataText(0, 0, '1st') # Set the text of (0,0) as '1st'. grid.setDataText(1, 0, '2nd') # Set the text of (1,0) as '2nd'. grid.setDataText(2, 0, '3rd') # Set the text of (2,0) as '3rd'. grid.setDataText(0, 1, '0 am') # Set the text of (0,1) as '0 am'. grid.setDataText(1, 1, '1 am') # Set the text of (1,1) as '1 am'. grid.setDataText(2, 1, '3 am') # Set the text of (2,1) as '3 am'. grid.setDataText(0, 2, '30000') # Set the text of (0,2) as '30000'. grid.setDataText(0, 3, '60000') # Set the text of (0,3) as '60000'. grid.setDataText(0, 4, '90000') # Set the text of (0,4) as '90000'. # Obtain the text of the 0th row and the 0th column. value = grid.dataText(0,0) print "Cell(0, 0) : ", value
|
This is a result. |
>> Cell(0, 0) :1st
|
headerText obtains the String of rows and columns of the grid widget header. Return the String of rows and columns of the grid widget header. Example) grid = canvas.getObject('GridWidget') # Obtain the grid widget. grid.setHeaderCount(2, 5) # Set data of the grid widget header to (2,5). # Merge (0,0), (1,0) of the grid widget header. grid.setHeaderSpan(0, 0, 2, 1); # Merge (0,1), (1,1) of the grid widget header. grid.setHeaderSpan(0, 1, 2, 1); # Merge (0,2), (0,3), (0,4) of the grid widget header. grid.setHeaderSpan(0, 2, 1, 3); grid.setHeaderText(0, 0, 'Date') # Set the text of (0,0) as 'Date'. grid.setHeaderText(0, 1, 'Date') # Set the text of (0,1) as 'Date'. grid.setHeaderText(0, 2, 'Electricity') # Set the text of (0,2) as 'Electricity'. grid.setHeaderText(1, 2, 'Moment') # Set the text of (1,2) as 'Moment'. grid.setHeaderText(1, 3, 'Maximum') # Set the text of (1,3) as 'Maximum'. grid.setHeaderText(1, 4, 'Cumulative') # Set the text of (1,4) as 'Cumulative'. # Set data of the grid widget to (5,5). grid.setDataCount(5, 5)
# Merge (0,0), (1,0), (2,0) of the grid widget. grid.setDataSpan(0, 0, 3, 1); grid.setDataText(0, 0, '1st') # Set the text of (0,0) as '1st'. grid.setDataText(1, 0, '2nd') # Set the text of (1,0) as '2nd'. grid.setDataText(2, 0, '3rd') # Set the text of (2,0) as '3rd'. grid.setDataText(0, 1, '0 am') # Set the text of (0,1) as '0 am'. grid.setDataText(1, 1, '1 am') # Set the text of (1,1) as '1 am'. grid.setDataText(2, 1, '3 am') # Set the text of (2,1) as '3 am'. grid.setDataText(0, 2, '30000') # Set the text of (0,2) as '30000'. grid.setDataText(0, 3, '60000') # Set the text of (0,3) as '60000'. grid.setDataText(0, 4, '90000') # Set the text of (0,4) as '90000'. # Obtain the text of the 0th row and the 0th column. value = grid.headerText(0,0) print "Header(0,0) : ", value
|
This is a result. |
>> Cell(0, 0) :1st
|
clearAll removes all data of the grid widget including the header.
Example) grid = canvas.getObject('GridWidget') # Obtain the grid widget. grid.clearAll() # Remove all data of the grid widget including the header. |
clearData removes all data of the grid widget. Example) grid = canvas.getObject('GridWidget') # Obtain the grid widget. grid.setHeaderCount(2, 5) # Set data of the grid widget header to (2,5). # Merge (0,0), (1,0) of the grid widget header. grid.setHeaderSpan(0, 0, 2, 1); # Merge (0,1), (1,1) of the grid widget header. grid.setHeaderSpan(0, 1, 2, 1); # Merge (0,2), (0,3), (0,4) of the grid widget header. grid.setHeaderSpan(0, 2, 1, 3); grid.setHeaderText(0, 0, 'Date') # Set the text of (0,0) as 'Date'. grid.setHeaderText(0, 1, 'Date') # Set the text of (0,1) as 'Date'. grid.setHeaderText(0, 2, 'Electricity') # Set the text of (0,2) as 'Electricity'. grid.setHeaderText(1, 2, 'Moment') # Set the text of (1,2) as 'Moment'. grid.setHeaderText(1, 3, 'Maximum') # Set the text of (1,3) as 'Maximum'. grid.setHeaderText(1, 4, 'Cumulative') # Set the text of (1,4) as 'Cumulative'. # Set data of the grid widget to (5,5). grid.setDataCount(5, 5)
# Merge (0,0), (1,0), (2,0) of the grid widget. grid.setDataSpan(0, 0, 3, 1); grid.setDataText(0, 0, '1st') # Set the text of (0,0) as '1st'. grid.setDataText(1, 0, '2nd') # Set the text of (1,0) as '2nd'. grid.setDataText(2, 0, '3rd') # Set the text of (2,0) as '3rd'. grid.setDataText(0, 1, '0 am') # Set the text of (0,1) as '0 am'. grid.setDataText(1, 1, '1 am') # Set the text of (1,1) as '1 am'. grid.setDataText(2, 1, '3 am') # Set the text of (2,1) as '3 am'. grid.setDataText(0, 2, '30000') # Set the text of (0,2) as '30000'. grid.setDataText(0, 3, '60000') # Set the text of (0,3) as '60000'. grid.setDataText(0, 4, '90000') # Set the text of (0,4) as '90000'. # Remove all data of the grid widget. grid.clearData()
|
|
clearHeader removes all header of the grid widget. Example) grid = canvas.getObject('GridWidget') # Obtain the grid widget. grid.setHeaderCount(2, 5) # Set data of the grid widget header to (2,5). # Merge (0,0), (1,0) of the grid widget header. grid.setHeaderSpan(0, 0, 2, 1); # Merge (0,1), (1,1) of the grid widget header. grid.setHeaderSpan(0, 1, 2, 1); # Merge (0,2), (0,3), (0,4) of the grid widget header. grid.setHeaderSpan(0, 2, 1, 3); grid.setHeaderText(0, 0, 'Date') # Set the text of (0,0) as 'Date'. grid.setHeaderText(0, 1, 'Date') # Set the text of (0,1) as 'Date'. grid.setHeaderText(0, 2, 'Electricity') # Set the text of (0,2) as 'Electricity'. grid.setHeaderText(1, 2, 'Moment') # Set the text of (1,2) as 'Moment'. grid.setHeaderText(1, 3, 'Maximum') # Set the text of (1,3) as 'Maximum'. grid.setHeaderText(1, 4, 'Cumulative') # Set the text of (1,4) as 'Cumulative'. # Set data of the grid widget to (5,5). grid.setDataCount(5, 5)
# Merge (0,0), (1,0), (2,0) of the grid widget. grid.setDataSpan(0, 0, 3, 1); grid.setDataText(0, 0, '1st') # Set the text of (0,0) as '1st'. grid.setDataText(1, 0, '2nd') # Set the text of (1,0) as '2nd'. grid.setDataText(2, 0, '3rd') # Set the text of (2,0) as '3rd'. grid.setDataText(0, 1, '0 am') # Set the text of (0,1) as '0 am'. grid.setDataText(1, 1, '1 am') # Set the text of (1,1) as '1 am'. grid.setDataText(2, 1, '3 am') # Set the text of (2,1) as '3 am'. grid.setDataText(0, 2, '30000') # Set the text of (0,2) as '30000'. grid.setDataText(0, 3, '60000') # Set the text of (0,3) as '60000'. grid.setDataText(0, 4, '90000') # Set the text of (0,4) as '90000'.
# Remove all header of the grid widget. grid.clearHeader() |
|
setDefaultTextAlignment sets the default String alignment of the grid widget. ㆍ flag: Enter the default String alignment of the grid widget. - GridWidgetItem.Left: Left alignment - GridWidgetItem.Right: Right alignment - GridWidgetItem.Center: Center alignment Example) grid = canvas.getObject('GridWidget') # Obtain the grid widget. #Set the default alignment as a left alignment. grid.setDefaultTextAlignment(GridWigetItem.Left) grid.setHeaderCount(2, 5) # Set data of the grid widget header to (2,5). # Merge (0,0), (1,0) of the grid widget header. grid.setHeaderSpan(0, 0, 2, 1); # Merge (0,1), (1,1) of the grid widget header. grid.setHeaderSpan(0, 1, 2, 1); # Merge (0,2), (0,3), (0,4) of the grid widget header. grid.setHeaderSpan(0, 2, 1, 3); grid.setHeaderText(0, 0, 'Date') # Set the text of (0,0) as 'Date'. grid.setHeaderText(0, 1, 'Date') # Set the text of (0,1) as 'Date'. grid.setHeaderText(0, 2, 'Electricity') # Set the text of (0,2) as 'Electricity'. grid.setHeaderText(1, 2, 'Moment') # Set the text of (1,2) as 'Moment'. grid.setHeaderText(1, 3, 'Maximum') # Set the text of (1,3) as 'Maximum'. grid.setHeaderText(1, 4, 'Cumulative') # Set the text of (1,4) as 'Cumulative'. # Set data of the grid widget to (5,5). grid.setDataCount(5, 5)
# Merge (0,0), (1,0), (2,0) of the grid widget. grid.setDataSpan(0, 0, 3, 1); grid.setDataText(0, 0, '1st') # Set the text of (0,0) as '1st'. grid.setDataText(1, 0, '2nd') # Set the text of (1,0) as '2nd'. grid.setDataText(2, 0, '3rd') # Set the text of (2,0) as '3rd'. grid.setDataText(0, 1, '0 am') # Set the text of (0,1) as '0 am'. grid.setDataText(1, 1, '1 am') # Set the text of (1,1) as '1 am'. grid.setDataText(2, 1, '3 am') # Set the text of (2,1) as '3 am'. grid.setDataText(0, 2, '30000') # Set the text of (0,2) as '30000'. grid.setDataText(0, 3, '60000') # Set the text of (0,3) as '60000'. grid.setDataText(0, 4, '90000') # Set the text of (0,4) as '90000'. |
|

defaultTextAlignment obtains the default String alignment set on the grid widget. ㆍ Return an Integer number between 0 to 2. The meaning of each number is as below. - 0 : GridWidgetItem.Left Left alignment - 1 : GridWidgetItem.Right Right alignment - 2 : GridWidgetItem.Center Center alignment Example) grid = canvas.getObject('GridWidget') # Obtain the grid widget. value = grid.defaultTextAlignment() # Obtain the default alignment. print 'value:',value # Left alignment if value == GridWidgetItem.Left: print 'GridWidgetItem.Left' # Right alignment elif value == GridWidgetItem.Right: print 'GridWidgetItem.Right' # Center alignment elif value == GridWidgetItem.Center: print 'GridWidgetItem.Center'
|
setGridColor sets the line color of the grid widget. ㆍ color: Set the line color of the grid widget. Set the line color using the QColor object. QColor object has to be set RGB color values and transparency values. Each value is an Integer number between 0 to 255. QColor is used as follows. ㆍ Function QColor(red,green,blue,transparency) ㆍ Use example - Red: QColor(255,0,0,255) - Green: QColor(0,255,0,128) - Blue: QColor(0,0,255,255) Example) grid = canvas.getObject('GridWidget') # Obtain the grid widget. grid.setHeaderCount(2, 5) # Set data of the grid widget header to (2,5). # Merge (0,0), (1,0) of the grid widget header. grid.setHeaderSpan(0, 0, 2, 1); # Merge (0,1), (1,1) of the grid widget header. grid.setHeaderSpan(0, 1, 2, 1); # Merge (0,2), (0,3), (0,4) of the grid widget header. grid.setHeaderSpan(0, 2, 1, 3); grid.setHeaderText(0, 0, 'Date') # Set the text of (0,0) as 'Date'. grid.setHeaderText(0, 1, 'Date') # Set the text of (0,1) as 'Date'. grid.setHeaderText(0, 2, 'Electricity') # Set the text of (0,2) as 'Electricity'. grid.setHeaderText(1, 2, 'Moment') # Set the text of (1,2) as 'Moment'. grid.setHeaderText(1, 3, 'Maximum') # Set the text of (1,3) as 'Maximum'. grid.setHeaderText(1, 4, 'Cumulative') # Set the text of (1,4) as 'Cumulative'. # Set data of the grid widget to (5,5). grid.setDataCount(5, 5)
# Merge (0,0), (1,0), (2,0) of the grid widget. grid.setDataSpan(0, 0, 3, 1); grid.setDataText(0, 0, '1st') # Set the text of (0,0) as '1st'. grid.setDataText(1, 0, '2nd') # Set the text of (1,0) as '2nd'. grid.setDataText(2, 0, '3rd') # Set the text of (2,0) as '3rd'. grid.setDataText(0, 1, '0 am') # Set the text of (0,1) as '0 am'. grid.setDataText(1, 1, '1 am') # Set the text of (1,1) as '1 am'. grid.setDataText(2, 1, '3 am') # Set the text of (2,1) as '3 am'. grid.setDataText(0, 2, '30000') # Set the text of (0,2) as '30000'. grid.setDataText(0, 3, '60000') # Set the text of (0,3) as '60000'. grid.setDataText(0, 4, '90000') # Set the text of (0,4) as '90000'. # Set the line color of the grid widget as blue. grid.setGridColor(QColor(0, 0, 255, 255)); |
|
gridColor obtains the line color set on the grid widget. ㆍ Return the String represented by HEX value. ㆍ Each RGB value is expressed in two decimal, hexadecimal. The expression range is 00 to FF. ㆍ Example) RGB values and HEX String - Black : QColor(0,0,0,255) #000000 - White : QColor(255,255,255) #FFFFFF - Red : QColor(255,0,0) #FF0000 Example) grid = canvas.getObject('GridWidget') # Obtain the grid widget. value = grid.gridColor(); # Obtain the line color of the grid widget. print value
|
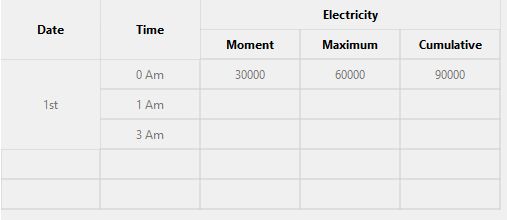
setEnabled sets enable or disable the grid widget. ㆍ enable : Enter enable or disable the grid widget as a number. - 0 : Disable the grid widget. - 1 : Enable the grid widget. Example)
grid = canvas.getObject('GridWidget') # Obtain the grid widget. grid.setHeaderCount(2, 5) # Set data of the grid widget header to (2,5). # Merge (0,0), (1,0) of the grid widget header. grid.setHeaderSpan(0, 0, 2, 1); # Merge (0,1), (1,1) of the grid widget header. grid.setHeaderSpan(0, 1, 2, 1); # Merge (0,2), (0,3), (0,4) of the grid widget header. grid.setHeaderSpan(0, 2, 1, 3); grid.setHeaderText(0, 0, 'Date') # Set the text of (0,0) as 'Date'. grid.setHeaderText(0, 1, 'Date') # Set the text of (0,1) as 'Date'. grid.setHeaderText(0, 2, 'Electricity') # Set the text of (0,2) as 'Electricity'. grid.setHeaderText(1, 2, 'Moment') # Set the text of (1,2) as 'Moment'. grid.setHeaderText(1, 3, 'Maximum') # Set the text of (1,3) as 'Maximum'. grid.setHeaderText(1, 4, 'Cumulative') # Set the text of (1,4) as 'Cumulative'. # Set data of the grid widget to (5,5). grid.setDataCount(5, 5)
# Merge (0,0), (1,0), (2,0) of the grid widget. grid.setDataSpan(0, 0, 3, 1); grid.setDataText(0, 0, '1st') # Set the text of (0,0) as '1st'. grid.setDataText(1, 0, '2nd') # Set the text of (1,0) as '2nd'. grid.setDataText(2, 0, '3rd') # Set the text of (2,0) as '3rd'. grid.setDataText(0, 1, '0 am') # Set the text of (0,1) as '0 am'. grid.setDataText(1, 1, '1 am') # Set the text of (1,1) as '1 am'. grid.setDataText(2, 1, '3 am') # Set the text of (2,1) as '3 am'. grid.setDataText(0, 2, '30000') # Set the text of (0,2) as '30000'. grid.setDataText(0, 3, '60000') # Set the text of (0,3) as '60000'. grid.setDataText(0, 4, '90000') # Set the text of (0,4) as '90000'. # Disable the grid widget. grid.setEnabled(0); # Enable the grid widget. grid.setEnabled(1); |
This is the disabled grid widget. |
|
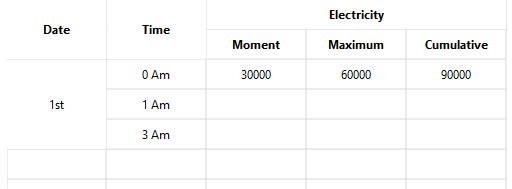
This is the enabled grid widget. |
|
restoreHeader sets the header of the grid widget back to the previous value. Example) grid = canvas.getObject('GridWidget') # Obtain the grid widget. grid.restoreHeader() # Set the header of the grid widget back to the previous value. |
setHeaderCellHeight sets the height of cells of the grid widget header. Example) grid = canvas.getObject('GridWidget') # Obtain the grid widget. grid.setHeaderCount(2, 5) # Set data of th grid widget header to (2,5). # Merge (0,0), (1,0) of the grid widget header. grid.setHeaderSpan(0, 0, 2, 1); # Merge (0,1), (1,1) of the grid widget header. grid.setHeaderSpan(0, 1, 2, 1); # Merge (0,2), (0,3), (0,4) of the grid widget header. grid.setHeaderSpan(0, 2, 1, 3); grid.setHeaderText(0, 0, 'Date') # Set the text of (0,0) as 'Date'. grid.setHeaderText(0, 1, 'Date') # Set the text of (0,1) as 'Date'. grid.setHeaderText(0, 2, 'Electricity') # Set the text of (0,2) as 'Electricity'. grid.setHeaderText(1, 2, 'Moment') # Set the text of (1,2) as 'Moment'. grid.setHeaderText(1, 3, 'Maximum') # Set the text of (1,3) as 'Maximum'. grid.setHeaderText(1, 4, 'Cumulative') # Set the text of (1,4) as 'Cumulative'. # Set data of the grid widget to (5,5). grid.setDataCount(5, 5) # Set the height of cells of the grid widget as 30. grid.setHeaderCellHeight(30) |
|

setHeaderCellHeight sets the height of cells of the grid widget. Example) grid = canvas.getObject('GridWidget') # Obtain the grid widget. grid.setHeaderCount(2, 5) # Set data of th grid widget header to (2,5). # Merge (0,0), (1,0) of the grid widget header. grid.setHeaderSpan(0, 0, 2, 1); # Merge (0,1), (1,1) of the grid widget header. grid.setHeaderSpan(0, 1, 2, 1); # Merge (0,2), (0,3), (0,4) of the grid widget header. grid.setHeaderSpan(0, 2, 1, 3); grid.setHeaderText(0, 0, 'Date') # Set the text of (0,0) as 'Date'. grid.setHeaderText(0, 1, 'Date') # Set the text of (0,1) as 'Date'. grid.setHeaderText(0, 2, 'Electricity') # Set the text of (0,2) as 'Electricity'. grid.setHeaderText(1, 2, 'Moment') # Set the text of (1,2) as 'Moment'. grid.setHeaderText(1, 3, 'Maximum') # Set the text of (1,3) as 'Maximum'. grid.setHeaderText(1, 4, 'Cumulative') # Set the text of (1,4) as 'Cumulative'. # Set data of the grid widget to (5,5). grid.setDataCount(5, 5)
for row in range(0, 5): str = row grid.setDataText(row, 0, str) # Set the height of cells of the grid widget as 30. grid.setDataCellHeight(30) |
|
setEditable sets whether all of the data is editable. ㆍ Set whether the cell of the grid widget is editable. - 1 : Set editable. - 0 : Set uneditable. Example) grid = canvas.getObject('GridWidget') # Obtain the grid widget. grid.setHeaderCount(2, 5) # Set data of th grid widget header to (2,5). # Merge (0,0), (1,0) of the grid widget header. grid.setHeaderSpan(0, 0, 2, 1); # Merge (0,1), (1,1) of the grid widget header. grid.setHeaderSpan(0, 1, 2, 1); # Merge (0,2), (0,3), (0,4) of the grid widget header. grid.setHeaderSpan(0, 2, 1, 3); grid.setHeaderText(0, 0, 'Date') # Set the text of (0,0) as 'Date'. grid.setHeaderText(0, 1, 'Date') # Set the text of (0,1) as 'Date'. grid.setHeaderText(0, 2, 'Electricity') # Set the text of (0,2) as 'Electricity'. grid.setHeaderText(1, 2, 'Moment') # Set the text of (1,2) as 'Moment'. grid.setHeaderText(1, 3, 'Maximum') # Set the text of (1,3) as 'Maximum'. grid.setHeaderText(1, 4, 'Cumulative') # Set the text of (1,4) as 'Cumulative'. # Set data of the grid widget to (5,5). grid.setDataCount(5, 5) for row in range(0, 5): str = row grid.setDataText(row, 0, str) # Set the entire data editable. grid.setEditable(1) |
|

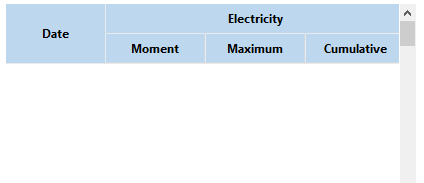
setHeaderTextColor changes the text color of headers of the grid widget. ㆍ Set the text color of headers of the grid widget. Set the color using QColor. QColor has to be set RGB color values and transparency values. Each value is an Integer number between 0 to 255. QColor is used as follows. ㆍ Function QColor(red,green,blue,transparency) ㆍ Use example - Red: QColor(255,0,0,255) - Green: QColor(0,255,0,128) - Blue: QColor(0,0,255,255) Example) grid = canvas.getObject('GridWidget') # Obtain the grid widget. grid.setHeaderCount(2, 5) # Set data of th grid widget header to (2,5). # Merge (0,0), (1,0) of the grid widget header. grid.setHeaderSpan(0, 0, 2, 1); # Merge (0,1), (1,1) of the grid widget header. grid.setHeaderSpan(0, 1, 2, 1); # Merge (0,2), (0,3), (0,4) of the grid widget header. grid.setHeaderSpan(0, 2, 1, 3); grid.setHeaderText(0, 0, 'Date') # Set the text of (0,0) as 'Date'. grid.setHeaderText(0, 1, 'Date') # Set the text of (0,1) as 'Date'. grid.setHeaderText(0, 2, 'Electricity') # Set the text of (0,2) as 'Electricity'. grid.setHeaderText(1, 2, 'Moment') # Set the text of (1,2) as 'Moment'. grid.setHeaderText(1, 3, 'Maximum') # Set the text of (1,3) as 'Maximum'. grid.setHeaderText(1, 4, 'Cumulative') # Set the text of (1,4) as 'Cumulative'. # Set data of the grid widget to (5,5). grid.setDataCount(5, 5) # Change the text color of headers of the grid widget. grid.setHeaderTextColor(QColor(70,129,189))
|
|
setHeaderTextSize changes the text size of headers of the grid widget. ㆍ size : Enter the size of texts. Example) grid = canvas.getObject('GridWidget') # Obtain the grid widget. grid.setHeaderCount(2, 5) # Set data of th grid widget header to (2,5). # Merge (0,0), (1,0) of the grid widget header. grid.setHeaderSpan(0, 0, 2, 1); # Merge (0,1), (1,1) of the grid widget header. grid.setHeaderSpan(0, 1, 2, 1); # Merge (0,2), (0,3), (0,4) of the grid widget header. grid.setHeaderSpan(0, 2, 1, 3); grid.setHeaderText(0, 0, 'Date') # Set the text of (0,0) as 'Date'. grid.setHeaderText(0, 1, 'Date') # Set the text of (0,1) as 'Date'. grid.setHeaderText(0, 2, 'Electricity') # Set the text of (0,2) as 'Electricity'. grid.setHeaderText(1, 2, 'Moment') # Set the text of (1,2) as 'Moment'. grid.setHeaderText(1, 3, 'Maximum') # Set the text of (1,3) as 'Maximum'. grid.setHeaderText(1, 4, 'Cumulative') # Set the text of (1,4) as 'Cumulative'. # Set data of the grid widget to (5,5). grid.setDataCount(5, 5) # Change the text size of headers of the grid widget to 12. grid.setHeaderTextSize(12) |
|
setHeaderBold sets the bold of the grid widget header. ㆍ enable : Set whether the header text is bold. - 1 : Bold - 0 : Not bold Example) grid = canvas.getObject('GridWidget') # Obtain the grid widget. grid.setHeaderCount(2, 5) # Set data of th grid widget header to (2,5). # Merge (0,0), (1,0) of the grid widget header. grid.setHeaderSpan(0, 0, 2, 1); # Merge (0,1), (1,1) of the grid widget header. grid.setHeaderSpan(0, 1, 2, 1); # Merge (0,2), (0,3), (0,4) of the grid widget header. grid.setHeaderSpan(0, 2, 1, 3); grid.setHeaderText(0, 0, 'Date') # Set the text of (0,0) as 'Date'. grid.setHeaderText(0, 1, 'Date') # Set the text of (0,1) as 'Date'. grid.setHeaderText(0, 2, 'Electricity') # Set the text of (0,2) as 'Electricity'. grid.setHeaderText(1, 2, 'Moment') # Set the text of (1,2) as 'Moment'. grid.setHeaderText(1, 3, 'Maximum') # Set the text of (1,3) as 'Maximum'. grid.setHeaderText(1, 4, 'Cumulative') # Set the text of (1,4) as 'Cumulative'. # Set data of the grid widget to (5,5). grid.setDataCount(5, 5) # Set the text of headers bold. grid.setHeaderBold(1)
|
|

setHeadeBackgroundColor sets the background color of the grid widget header. ㆍ color: Set the background color of the header. Set the color using QColor. QColor object has to be set RGB color values and transparency values. Each value is an Integer number between 0 to 255. QColor is used as follows. ㆍ Function QColor(red,green,blue,transparency) ㆍ Use example - Red: QColor(255,0,0,255) - Green: QColor(0,255,0,128) - Blue: QColor(0,0,255,255) Example) grid = canvas.getObject('GridWidget') # Obtain the grid widget. grid.setHeaderCount(2, 5) # Set data of th grid widget header to (2,5). # Merge (0,0), (1,0) of the grid widget header. grid.setHeaderSpan(0, 0, 2, 1); # Merge (0,1), (1,1) of the grid widget header. grid.setHeaderSpan(0, 1, 2, 1); # Merge (0,2), (0,3), (0,4) of the grid widget header. grid.setHeaderSpan(0, 2, 1, 3); grid.setHeaderText(0, 0, 'Date') # Set the text of (0,0) as 'Date'. grid.setHeaderText(0, 1, 'Date') # Set the text of (0,1) as 'Date'. grid.setHeaderText(0, 2, 'Electricity') # Set the text of (0,2) as 'Electricity'. grid.setHeaderText(1, 2, 'Moment') # Set the text of (1,2) as 'Moment'. grid.setHeaderText(1, 3, 'Maximum') # Set the text of (1,3) as 'Maximum'. grid.setHeaderText(1, 4, 'Cumulative') # Set the text of (1,4) as 'Cumulative'. # Set data of the grid widget to (5,5). grid.setDataCount(5, 5) # Set the text color of the grid widget header as QColor(255,255,255). grid.setHeaderTextColor(QColor(255, 255, 255)) # Set the background color of the grid widget header as QColor(79,129,189). grid.setHeaderBackgroundColor(QColor(79, 129, 189)) |
|

Set the width of cells. Example) grid = canvas.getObject('GridWidget') # Obtain the grid widget. grid.setColumnWidth(0 , 200) # Set the width of 0th cell as 200. |
Save the data to the cell. Example) grid = canvas.getObject('GridWidget') # Obtain the grid widget. grid.setCellData(2, 2, 'key') # Set the data of (2,2) as key. |
Read the data saved on the cell. Example) grid = canvas.getObject('GridWidget') # Obtain the grid widget. data = grid.cellData(2, 2) # Read the data of (2,2). |
Read the range of the currently selected cells.
Example) grid = canvas.getObject('GridWidget') # Obtain the grid widget. top, left, bottom, right = grid.selectedRange( ) # Read the range of the selected cell on the current grid widget. # The printed values are 0, 0, 3, 2. print top, left, bottom, right |
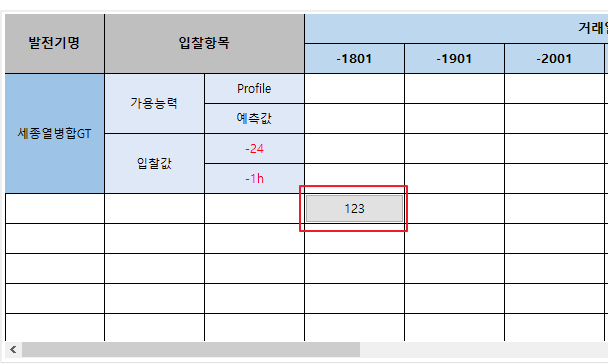
Insert the press button to the cell. Example)
grid = canvas.getObject('GridWidget') # Obtain the grid widget. data = grid.setPushButton(4, 3) # Insert the push button to (4,3). |
|
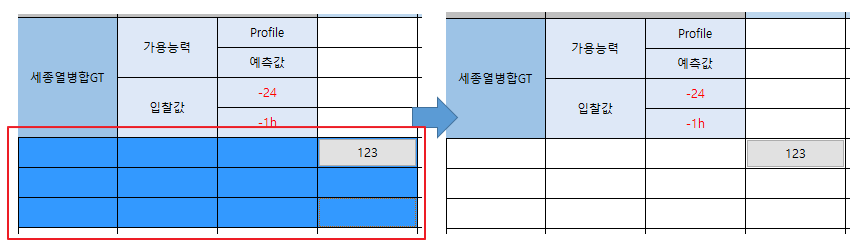
Cancel the selection of cells. Example) grid = canvas.getObject('GridWidget') # Obtain the grid widget. grid.clearSelection() # Cancel the selectiong of cells. |
Results)
|
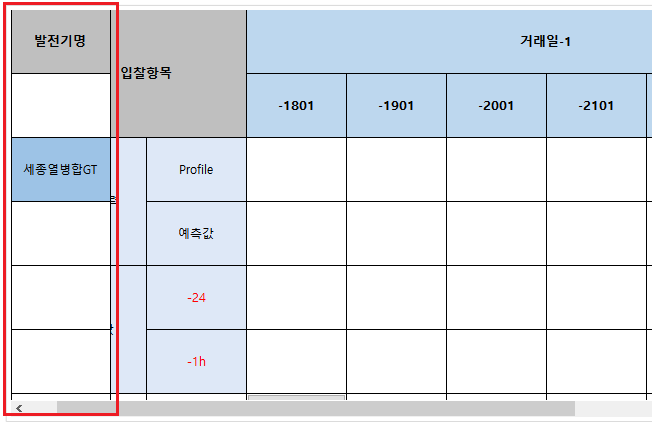
setFrozenColumn sets the fixed column by selecting the row of the grid widget. ㆍ col: Enter columns to hold. Example) grid = canvas.getObject('GridWidget') # Obtain the grid widget. grid.setFrozenColumn(0) # Set the 0th column to the fixed column. |
Results)
|
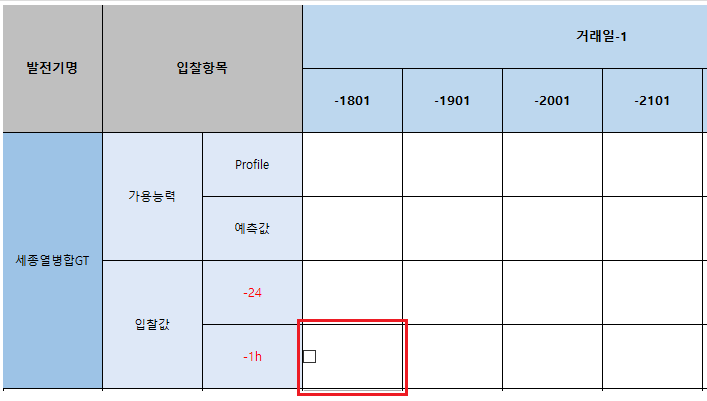
setCheckBox inserts a check box by selecting the row and column of the grid widget. ㆍ row: Enter rows to insert the check box. ㆍ col: Enter columns to insert the check box. Example) grid = canvas.getObject('GridWidget') # Obtain the grid widget. grid.setCheckBox(3, 3) # Insert a check box to (3,3). |
Results)
|
isChecked reads the check state of check boxes by selecting the row and column of the grid widget. ㆍ row: Enter the row to check the state of check boxes. ㆍ col: Enter the column to check the state of check boxes. Example) grid = canvas.getObject('GridWidget') # Obtain the grid widget. grid.isChecked(3, 3) # Read the check box state of (3,3). |
setChecked sets the checks state of check boxes by selecting rows and columns of the grid widget. ㆍ row: Enter rows to set the check of check boxes. ㆍ col: Enter columns to set the check of check boxes. ㆍ checked: Set the check state of check boxes. - Unchecked : 0 - Checked : 1 Example) grid = canvas.getObject('GridWidget') # Obtain the grid widget. grid.setChecked(3, 3, 1) # Set the check box of (3,3) to the checked state. |
Results)
|
Events occur based on the check state of check boxes by selecting rows and columns. Example) def cellButtonClicked2(row, column, checked) print row, column, checked grid = canvas.getObject('GridWidget') # Obtain the grid widget. # cellButtonClicked2 function is recalled based on the state of check boxes by selecting rows and columns. grid.connect('checkBoxChecked(int, int, bool)', cellButtonClicked2) |