History Data Chart
History Data Chart
![]() History data chart is used to display historical data as a graph. Print the data history or the data set to the history data group using the History data chart.
History data chart is used to display historical data as a graph. Print the data history or the data set to the history data group using the History data chart.
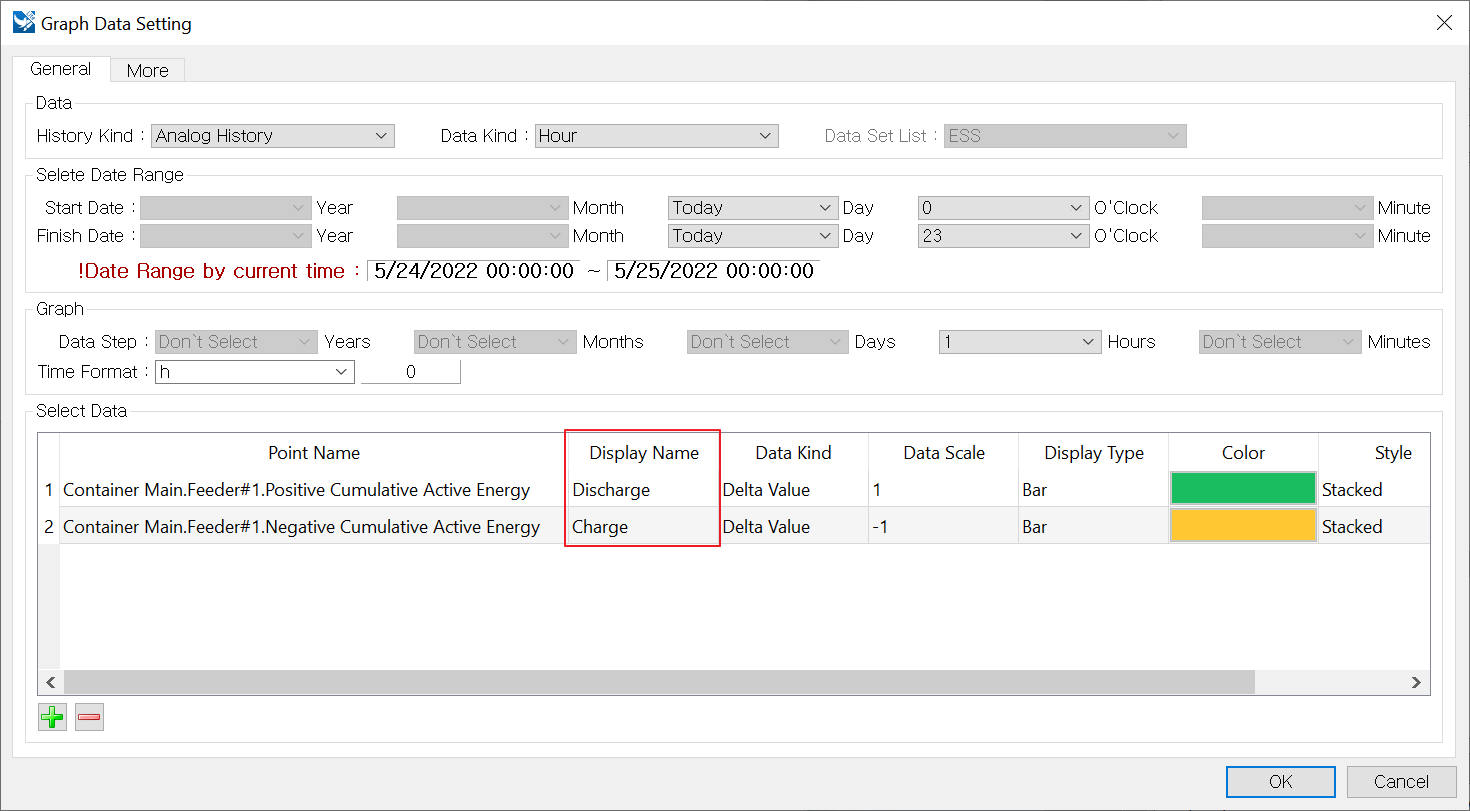
[Select history data and print the data]
User is able to apply the following functions using scripts.
- It is able to print the history data of the selected day on the graph.
- It is able to read the data displayed on the graph.
- It is able to display various data on a graph by changing the name of the data set on the graph.
Methods
To use the history data chart widget object, obtain the widget using the canvas object. The below scripts are available in the history data chart widget object.
Scripts for the History data chart is the same as for the Data chart. Refer to the [Data Chart] function.
Return Type |
Method |
Description |
Add the data of bar graphs to the chart. |
||
Add the data of curve graphs to the chart. |
||
Add the data of line graphs to the chart. |
||
Enter the name of graphs to use the right Y-axis. |
||
Set the style of bar graphs. |
||
Set the line color of bar graphs. |
||
Set the space of bar graphs. |
||
setDataVisible( index, visible ) |
Reveal or hide the graph. |
|
Set the line color of line graphs to the chart. |
||
Set the line style of line graphs to the chart. |
||
Set the line width of line graphs to the chart. |
||
Set a line form of marker to the Chart. |
||
setMarker( name, index, markerColor, labelColor, textSize, pointSize ) |
Set a dot form of marker to the chart. |
|
setMarkerStyle( name, fontSize, textColor, lineColor, lineWidth, style ) |
Set the style of marker to the chart. |
|
Set the range and space of the right Y-axis to the chart. |
||
Set the range and space of Y-axis to the chart. |
History data chart provides the following table.
Return Type |
Method |
Description |
list[float] |
Read the data value of graphs. |
|
Print the data of the period between the start date to the end date on the widget. |
||
Print the data of the entered day on the widget. |
||
It is used to change the name of the selected data and print on a graph. |
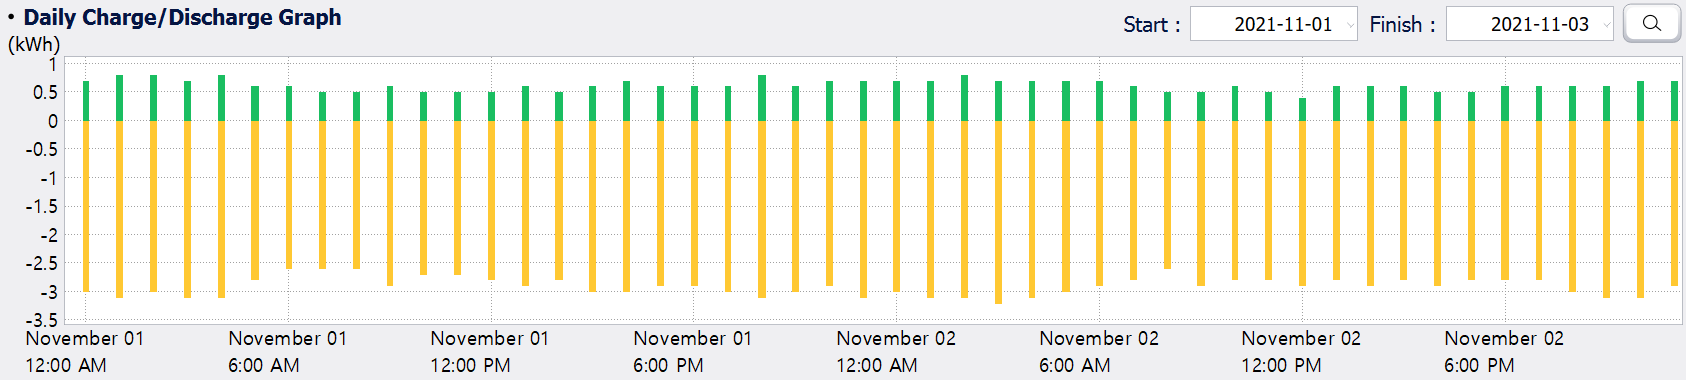
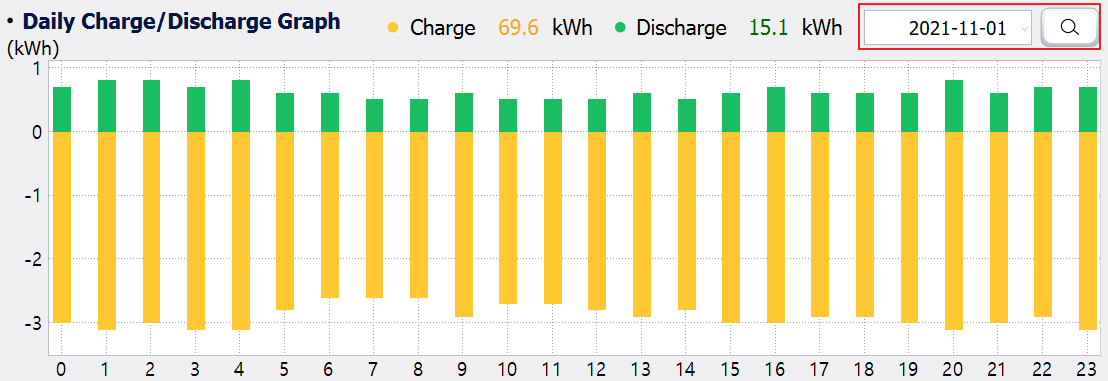
Read the data printed on the graph. ㆍ name : Enter the name of graphs set on the history data chart widget. Example)
hp1 = canvas.getObject('hp1') #Obtain the history data chart widget. print hp1.getGraphData('Charge') |
Output)
(-3.0, -3.100000000000364, -3.0, -3.100000000000364, -3.099999999998545, -2.8000000000010914, -2.600000000000364, -2.599999999998545, -2.600000000000364, -2.899999999999636, -2.7000000000007276, -2.7000000000007276, -2.7999999999992724, -2.899999999999636, -2.8000000000010914, -3.0, -3.0, -2.899999999999636, -2.899999999999636, -3.0, -3.100000000000364, -3.0, -2.899999999999636, -3.100000000000364) |
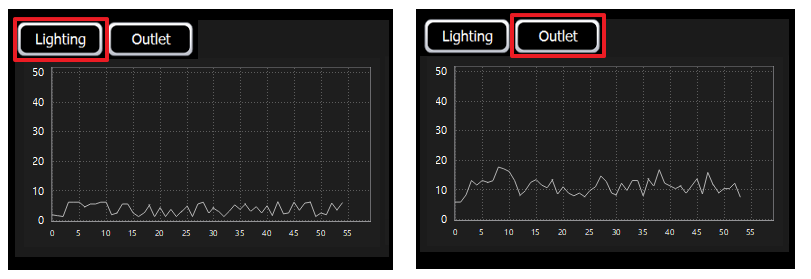
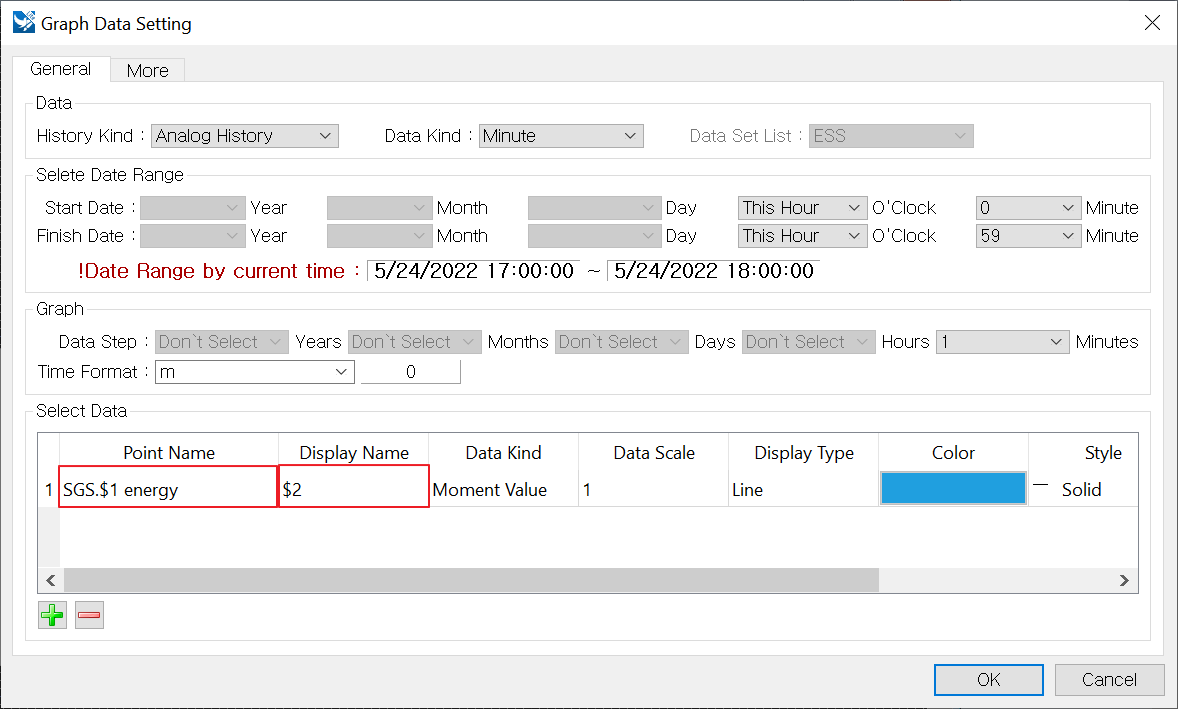
replaceText is used to change the name of the data set on graphs, and print various data on one graph widget. Like the below features, if clicking the [Lighting] button, it calls the corresponding data, and if clicking the [Outlet] button, calls the office data. If you want to use replaceText, pre-set the name you want to change using the script as below features. If you set the String to $1,$2 as below, it can call the data by replacing $1,$2 to the desired text.
-> ['Replace text:Current text' ,'Replace text:Current text' ,.....] Example)
g = canvas.getObject('gra') # Obtain the history data chart widget. g.replaceText(['$1:Lighting#1', '$2:Lighting']) # Replace '$1', '$2' with 'Lighting#1' , 'Lighting' respectively. |